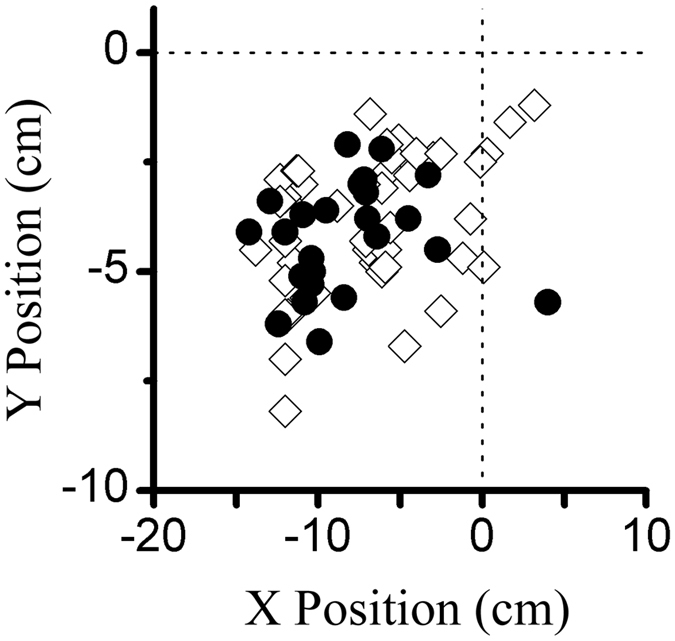
Figure 8. The distribution of the receptive field centre.

The solid circles and hollow diamonds represent cells in the S334ter-3 and LE rats, respectively. The dotted lines indicate the centre of the screen display.

The solid circles and hollow diamonds represent cells in the S334ter-3 and LE rats, respectively. The dotted lines indicate the centre of the screen display.