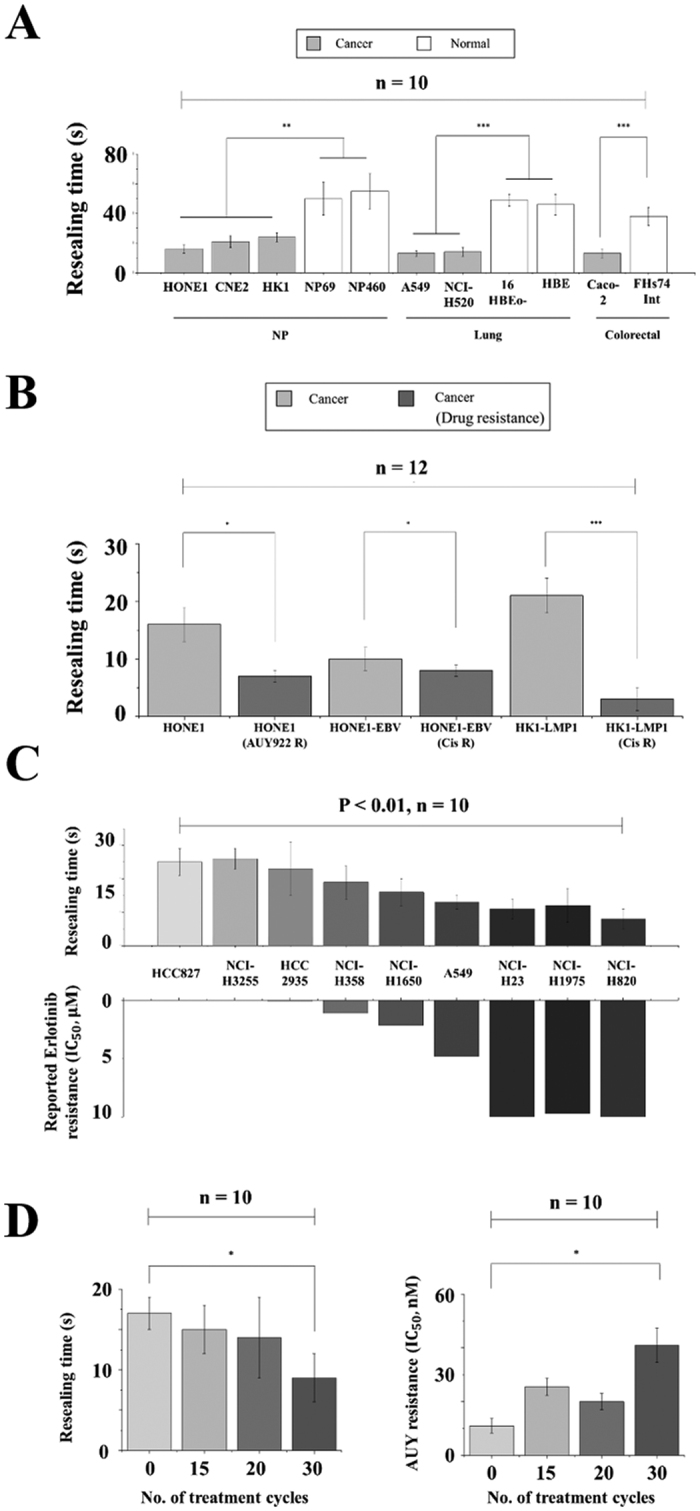
Figure 2. Resealing time comparison among cell lines.

(A) Comparison between the measured resealing time of 1 μm membrane pores in different cancer and corresponding normal cell lines. (B) Bar plots of the resealing time of nasopharyngeal drug-resistant cell lines (HONE1-AUY R, HONE1-EBV Cis R and HK1-LMP1 Cis R) along with their parental cell lines (HONE1, HONE1-EBV, and HK1-LMP1) that are drug-sensitive. (C) Bar plots of the resealing time of lung cancer cells with different reported Erlotinib resistance (characterized by the critical Erlotinib concentration required to achieve 50% growth inhibition, i.e.IC50). (D) The resealing time of HONE1 cell line in different phases of AUY922 treatment cycles where the drug-resisting capability of cells is described by IC50 of AUY922, similar to that in (C). Asterisks here denote a statistically significant difference by t-test (*P < 0.05, **P < 0.01, ***P < 0.001) between paired samples and n stands for the number of independent trials. Results shown in (A–C) all have a statistical significance of P < 0.01 by one sample t-test while P < 0.05 in (D).
