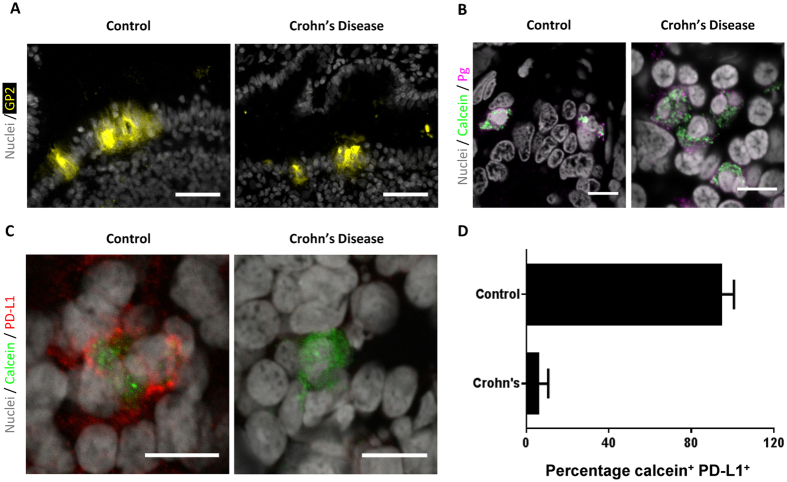
Figure 2. APCs in the NAP pathway show defective PD-L1 expression in Crohn’s disease.
(A) Representative fluorescent micrographs showing M cells (identified by glycoprotein 2 staining; yellow) in the epithelium overlaying lymphoid patches in Crohn’s disease and control sections. Scale bars are 50 μm. (B) Typical confocal micrographs demonstrating the presence of peptidoglycan (Pg; magenta) in nanomineral positive cells (identified by calcein; green) in both Crohn’s disease and control sections. Scale bars are 10 μm. (C) Example confocal micrographs of Crohn’s disease and control ileal lymphoid patch cells showing that APCs from control tissue are both nanomineral (calcein-stained, green) and PD-L1 (red) positive, but Crohn’s disease associated APCs are nanomineral positive and PD-L1 negative. Scale bars are 10 μm. (D) Percentage of nanomineral (calcein-stained) and PD-L1 positive cells in control and Crohn’s disease tissue (Crohn’s disease versus control: p < 0.0004 using the Mann-Whitney test). Data are shown as mean + SD. In all cases samples were tested from 6 independent tissues for Crohn’s disease and 9 independent tissues for control tissues. In total 177 calcein (nanomineral) positive cells were identified in the Crohn’s disease samples, and 191 calcein (nanomineral) positive cells in the control tissues.

