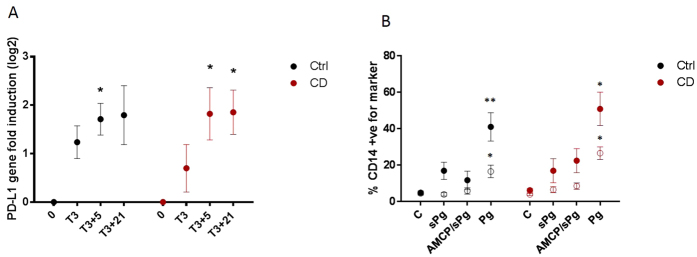
Figure 4. NAP induced PD-L1 expression in peripheral blood mononuclear cells of patients with Crohn’s disease is conserved.
(A) Time-course of CD274 (encoding PD-L1) gene expression following an initial 3 hour exposure to particulate Pg (AMCP/sPG) in peripheral blood mononuclear cells from healthy (black; n = 4) and Crohn’s disease (red; n = 6) individuals. Timepoints represent the following: 0 = no stimulation; T3 = expression at end of 3 hour stimulation; T3 + 5 and T3 + 21; expression following, respectively, a further 5 hours and 21 hours incubation in the control medium (i.e. absence of further stimulus). (B) PD-L1 (closed symbols) and PD-L2 (open symbols) surface expression following exposure to soluble Pg (sPg), particulate Pg (AMCP/sPg) and crude Pg (Pg) in CD14+ cells from healthy (black; n = 4) and Crohn’s disease (red; n = 6) donors. Data was obtained following a 3 hr stimulation and a further 21 hr incubation in control medium and is expressed as Mean ± SEM. Statistical significance of gene induction was calculated by repeated measurement one-way ANOVA with Dunnett’s multiple comparisons; and for protein expression levels using paired two-tailed t-tests. *p < 0.05, **p < 0.01. Ctrl = Controls. CD = Crohn’s disease.

