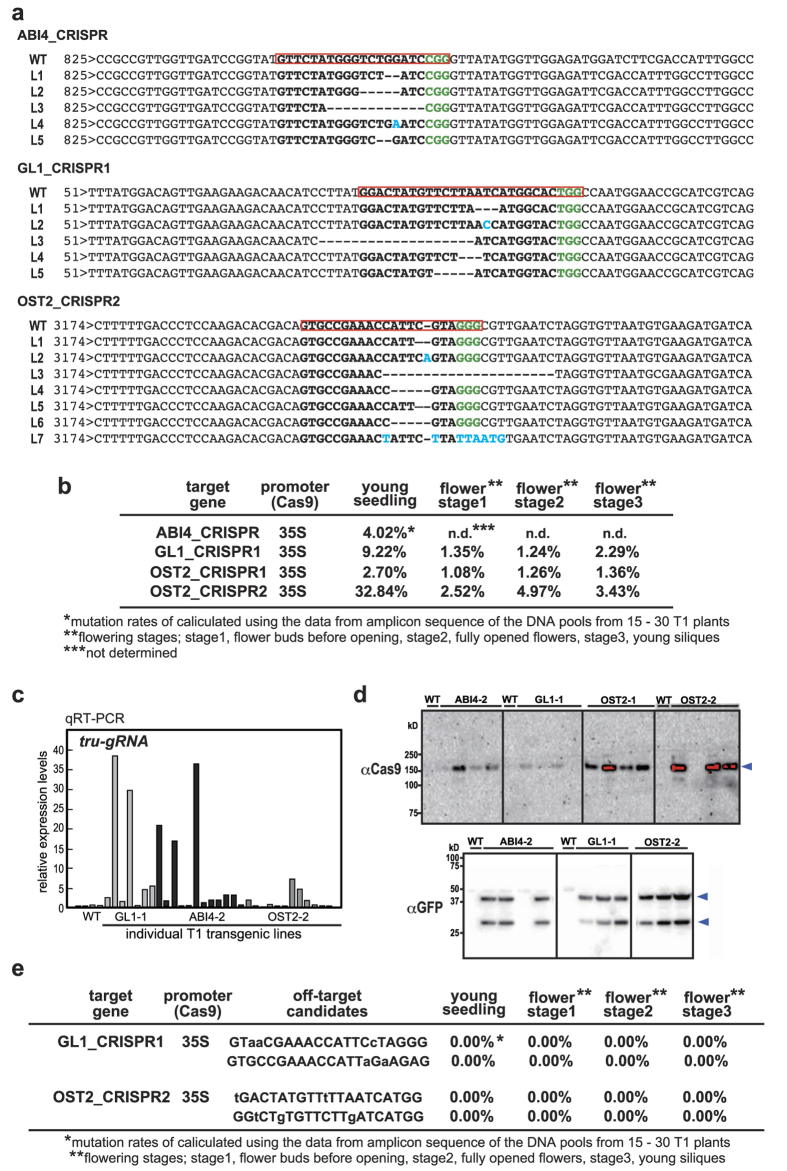
Figure 2. Analysis of the mutated sequences induced by tru-gRNAs.
(a) Various types of CRISPR/Cas9-induced mutation detected by amplicon sequencing in T1 plants. The red boxes indicate target sites and green characters are PAM sequences. The blue characters show the nucleotide insertion. L1-7; the individual T1 lines for the transgenic plants. (b) The mutation rates analyzed by next-generation amplicon-based deep sequencing using mixed DNA pools from 15–30 GFP-positive T1 plants. (c) The detection of sgRNA expression levels in individual T1 Arabidopsis plants with each sgRNA specific primer with qRT-PCR. The value for one of the T1 lines of each construct was set to 1.0. To normalize the expression levels, 18S rRNA was amplified as an internal control. WT; wild-type Arabidopsis. (d) Protein blot analysis of GFP and Cas9 was performed with the individual T1 plants using an anti-GFP and Cas9 antibody, respectively. (e) The off-target mutation rates analyzed by next-generation amplicon-based deep sequencing using mixed DNA pools from 15–30 GFP-positive T1 plants. The off-target rates were shown by calculating the differences between these values and those from wild-type Arabidopsis (data not shown).

