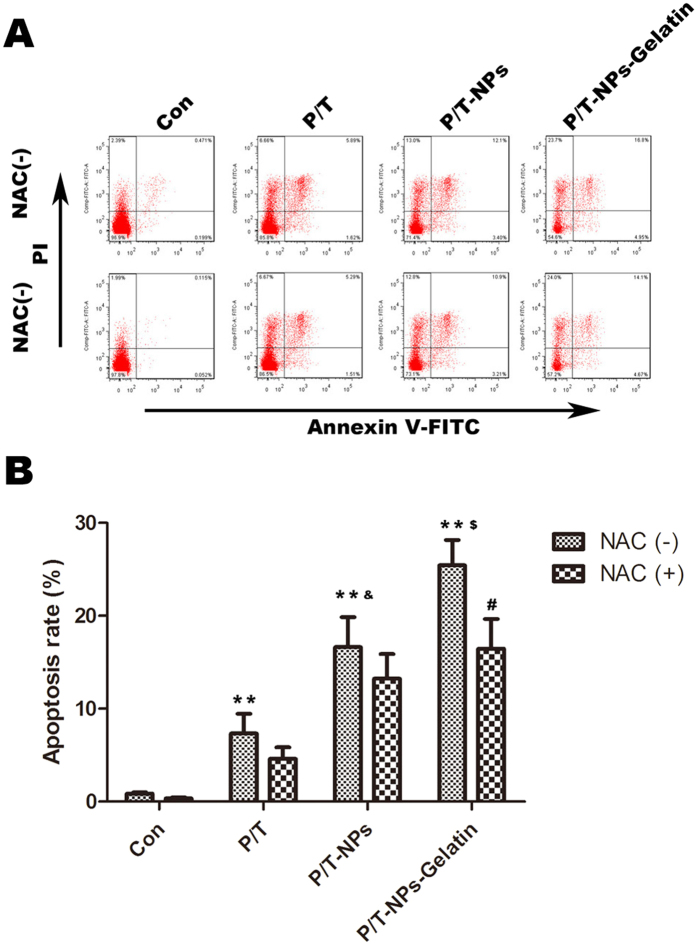
Figure 4. Induction of apoptosis by Ptx and Tet in different formulations with or without the presence of N-acetyl cysteine (NAC) detected by FACS.
(A) Apoptosis of cells detected by FACS when exposed to different agents for 48 h. (B) Quantification of apoptosis rate based on FACS results. **represents p < 0.01 vs control group. $represents p < 0.01 vs the corresponding group treated with P/T-NPs. & represents p < 0.01 vs the corresponding group treated with P/T. #represents p < 0.05 vs the corresponding group of P/T-NPs-Gelatin without the co-treatment of NAC.

