
Figure 9.
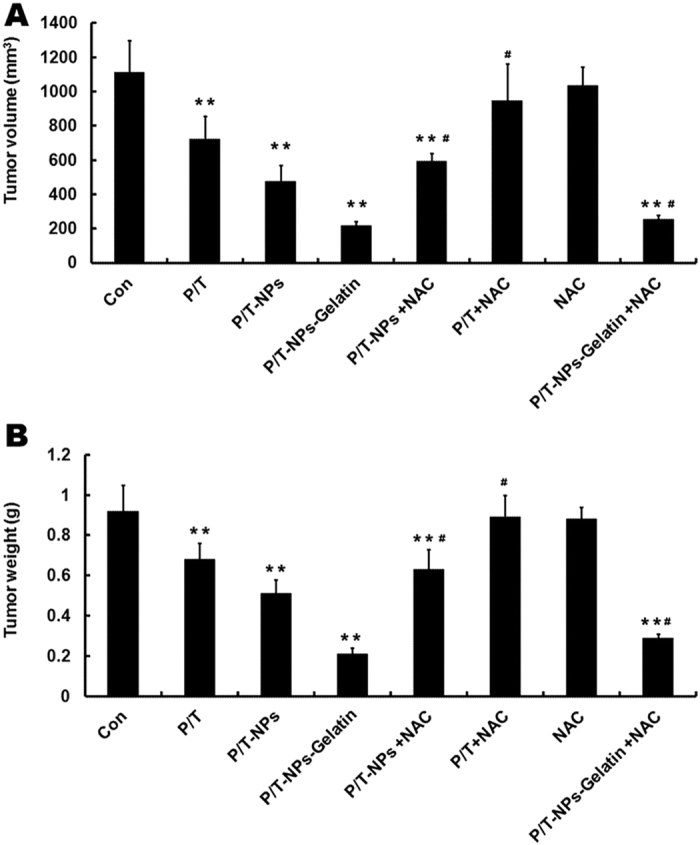
Tumor volume (A) and weight (B) of mice receiving different formulations of Ptx and Tet at the end of experiment. Each data point represents the mean ± SD; **represents p < 0.01 versus control. #represents p < 0.05 versus the corresponding group without the presence of N-acetyl cysteine (NAC).