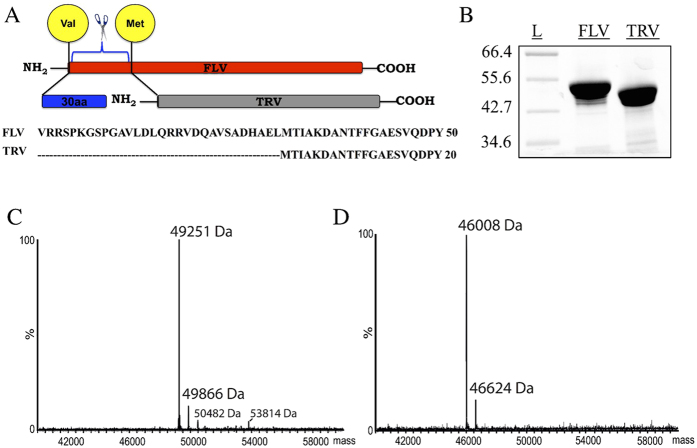
Figure 3. Expression and purification of CYP144A1-FLV and CYP144A1-TRV.
Panel (A) shows the genetic truncation of the intact CYP144A1-FLV (red) to form CYP144A1-FLV – removing the gene segment encoding residues Va11 to Leu30, shown with the CYP144A1-FLV (Val) and -TRV (Met) initiator residues in yellow circles. This produces the CYP144A1-TRV (grey), with 30 amino acids fewer than CYP144A1-FLV (red). Panel (B) shows purification and approximate molecular weight determination of CYP144A1-FLV and -TRV by SDS-PAGE analysis, with markers of indicated mass (kDa) in the first lane. Panels (C,D) show accurate mass spectra of CYP144A1-FLV (49251 Da) and CYP144A1-TRV (46008 Da) obtained by high-resolution mass spectrometry under denaturing conditions using 40 μM protein in both cases.

