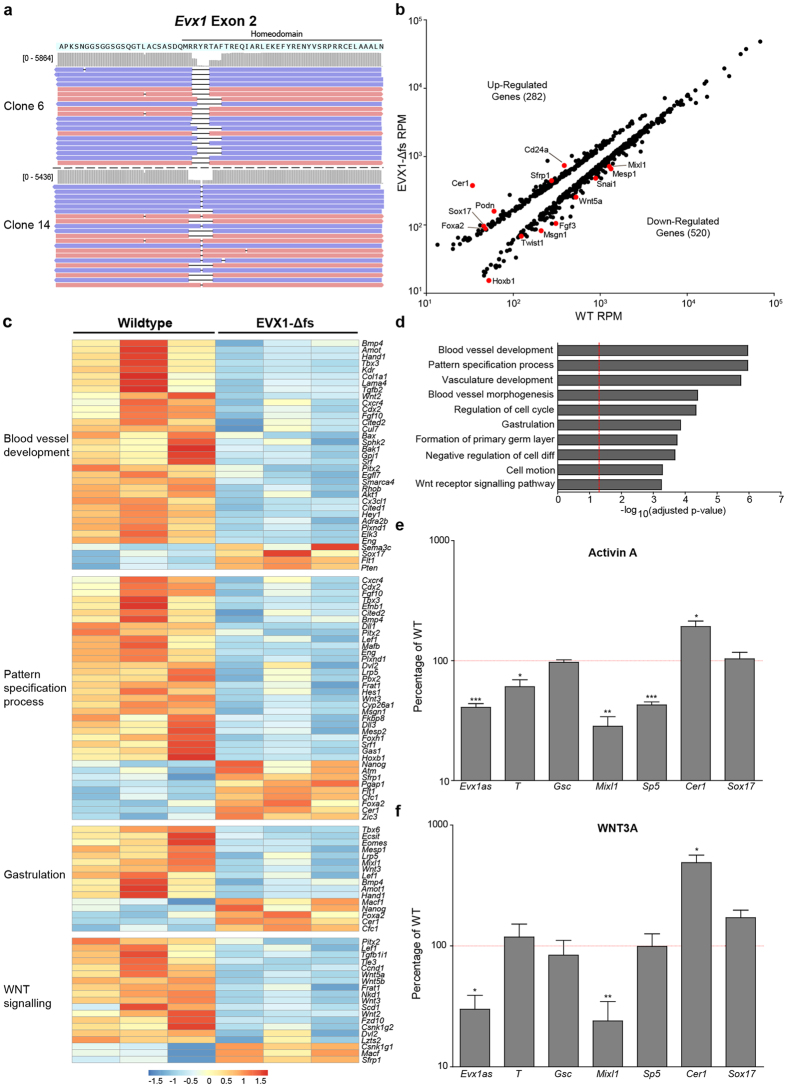
Figure 2. EVX1 is required to regulate anterior-posterior patterning during gastrulation.
(a) Visualization of CRISPR-induced mutations in two independent mESC clones (clone 6 and 14) using Integrated Genome Viewer (IGV). The peptide sequence of EVX1 is shown. Red and blue indicate different read strands. (b) Scatterplot of average counts of DEGs from mRNAseq comparing 3 replicates of WT and EVX1-Δfs Day 4 EBs. Known markers and regulators of tissue specification are shown in red. RPM = Reads per million reads.(c) Heatmap of counts for differentially expressed genes corresponding to particular Gene Ontology (GO) terms in (d). Each category is hierarchically clustered. Each value is normalized to its mean expression across all samples. Red indicates higher than average expression, blue indicates lower than average expression. (d) GO analysis (DAVID) of DEGs shows the biological processes disrupted in the EVX1-Δfs D4 EBs. Red line indicates an adjusted p-value of 0.05. (e,f) Expression profiling of EVX1-Δfs in SFM supplemented with (e) Activin A (10 ng/ul) or (f) WNT3A (20 ng/ul). Expression of each gene in each sample was first normalized to Hprt then normalized to WT expression. 4 biological replicates were performed. *Indicates a p-value < 0.05, **indicates a p-value < 0.01, ***indicates a p-value < 0.001 when compared to WT. All error bars indicate SEM.

