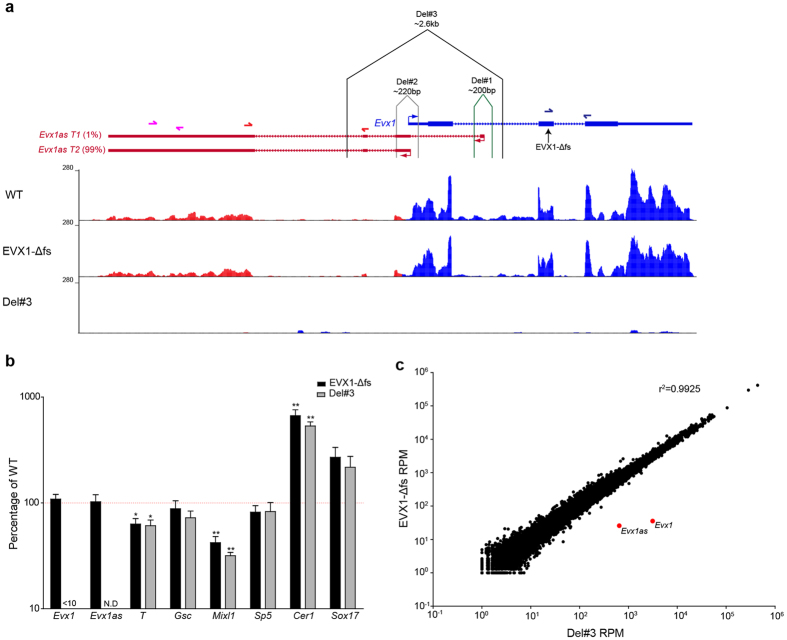
Figure 3. Evx1as does not have a function independent of EVX1.
(a) Schematic of the strategy for dissecting the Evx1/Evx1as locus modified from USCS Genome Browser. The three different deletions performed are shown on the diagram. Wiggle tracks of WT, EVX1-Δfs and Del#3 mRNAseq from D4 EBs are shown. Corresponding qPCR primers pairs are shown in the same colour. The location of the Evx1 deletion is indicated by the arrow. Del = deletion, T1 = transcript 1, T2 = transcript 2. (b) Expression profiling of EVX1-Δfs and Del#3. Expression of each gene in each sample was first normalized to Hprt then normalized to WT expression. 4 biological replicates were performed. Error bars show SEM. *Indicates a p-value < 0.05, **indicates a p-value < 0.01, when compared to WT. No significant differences were found when comparing EVX1-Δfs and Del#3. N.D = not detected. <10 = less than 10% of WT. (c) Scatter plot of average mRNAseq counts from three replicates comparing EVX1-Δfs and Del #3 D4 EBs. Evx1 and Evx1as are shown in red. A value of 1 was added to all RPM values to improve visualization. R2 was obtained from Pearson Correlation. RPM = Reads per million reads.

