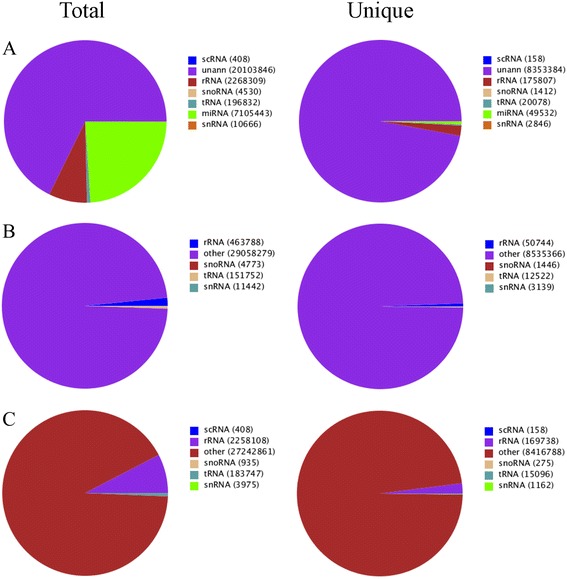
Fig. 2.

Distribution of small RNAs by annotation categories. Pie chart shows pomegranate small RNAs matching data in the non-coding RNA database. a Cumulative distribution of different non-coding small RNA categories pooled from Rfam and NCBI. b Small RNAs matching Rfam non-coding RNAs. c Small RNAs matching GenBank non-coding RNAs. Each small RNA database shows differences in subcategories depending on the availability of existing data
