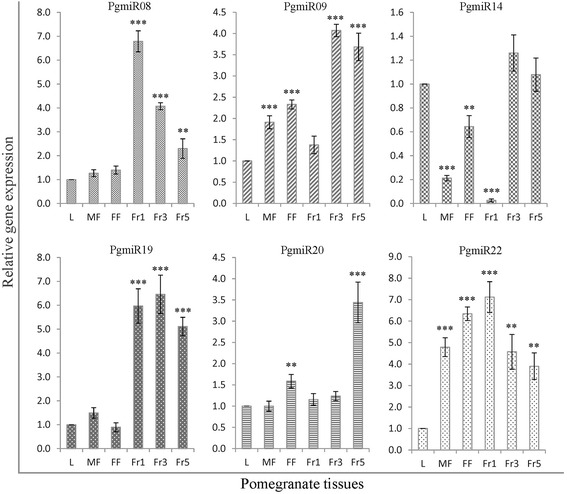
Fig. 7.

Stem-loop RT-qPCR validation of novel miRNAs in various pomegranate tissues. Relative quantity is based on expression of the reference gene 5.8 s ribosomal RNA. X-axis indicates different tissues (L, leaf; MF, male flower; FF, female flower; Fr1, fruit stage 1; Fr3, fruit stage 3; Fr5, fruit stage 5) and Y-axis indicates the expression of miRNA relative to that in leaf tissue. Data are mean ± SD from three biological replicates. **, P < 0.01; ***, P < 0.001 by Student t test. Bar values higher or lower compared to leaf tissue indicates upregulation or downregulation, respectively
