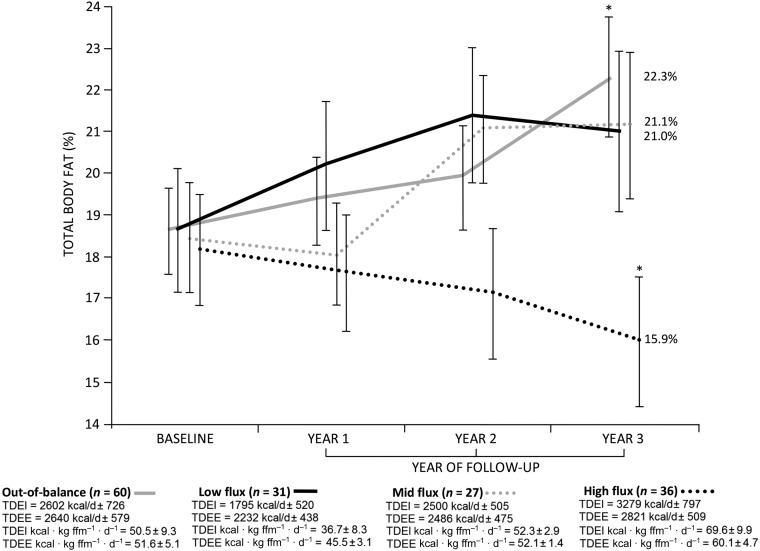
FIGURE 3.
Total fat mass (percentage) at baseline and years 1–3 of follow-up (study 1). Data are means ± SEs. Labels refer to body fat (percentage) at final follow-up. Whereas no group differences were seen for percentage of body fat at baseline or follow-up at years 1 and 2, out-of-balance participants exhibited greater overall body adiposity at year 3 of follow-up than did their high-flux counterparts. Per group is reported. *P = 0.005; 1-factor ANOVA with Bonferroni adjustment. ffm, fat-free mass; TDEE, total daily energy expenditure; TDEI, total daily energy intake.

