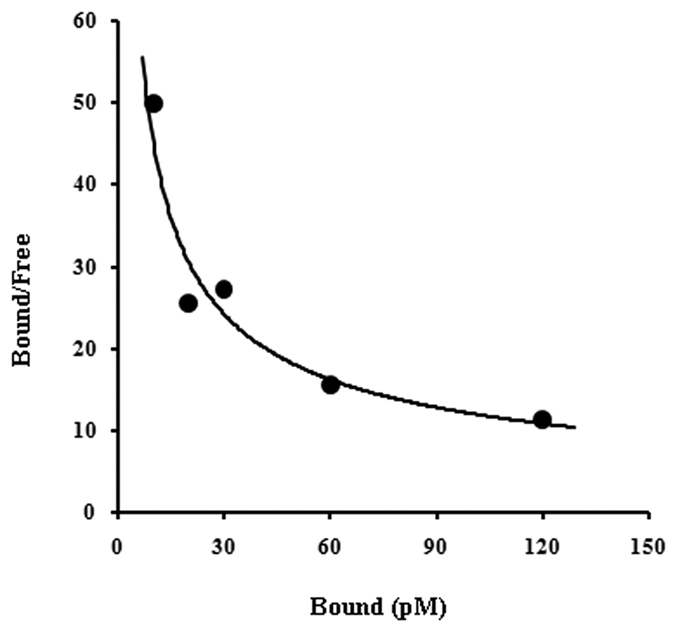
Figure 3. Scatchard plot analysis of equilibrium binding of insulin to the casein in presence of different concentration of insulin.

Casein was incubated with different concentrations of insulin for 150 min. Unbound insulin was separated from casein bound insulin using by Millipore filtration unit as described in Methods and Materials. Bound insulin was released from casein in presence of 0.05% Triton-X-100 and the amount of insulin was analyzed by ELISA method by using insulin antibody. Dissociation constant (Kd) and binding capacity (n = number of insulin binding molecules/casein) was analyzed from Scatchard plot. From the analysis it was found a curvilinear plot of heterogeneous binding sites population of insulin on casein.
