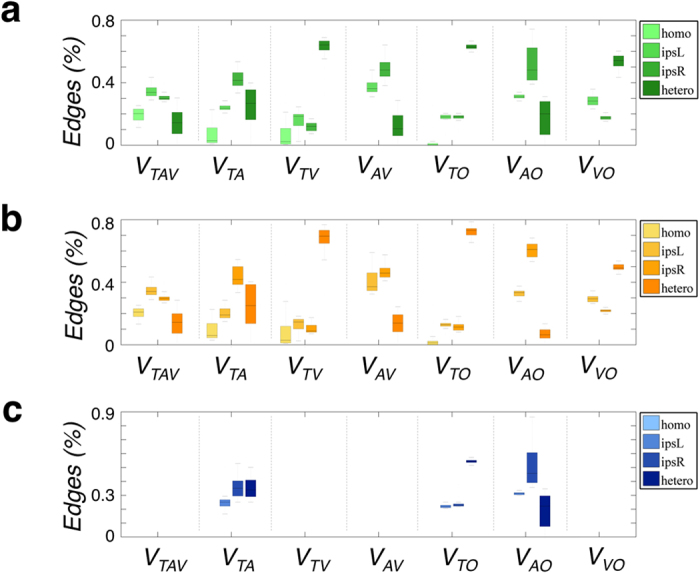
Figure 3. The percentages of the four types of edges, that is, the homotopic, the left and right ipsilateral, and heterotopic connections were plotted.

(a) The edges show both signs, with positive and negative correlation coefficients between regions. (b) The edges show only positive correlation. (c) The edges show only negative correlation. In each box, the central mark is the median, the edges of the box are the 25th and 75th percentiles, and the box color indicates the connection type.
