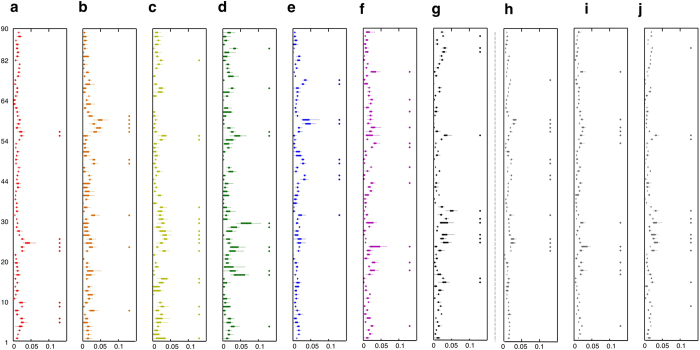
Figure 4. The hub regions in seven partitions and MCNs.
Each partition (a–j) was marked as follows: (a) VTAV, (b) VTA, (c) VTV, (d) VAV, (e) VTO, (f) VAO, (g) VVO, and (h) MT, (i) MA, and (j) MV indicate the adjacency matrix of cortical thickness, surface area, and gray matter volume, respectively. In each box, the central mark is the median, the edges of the box are the 25th and 75th percentiles of the normalized degree of a node ( ) at each sparsity. Hi is the average of the normalized degree of a node (
 ) over the sparsity range. The hub regions were defined as the nodes with higher than mean (Hi) + standard deviation (Hi) and marked as circle with same color in each box plot. Abbreviations for the cortical regions and number of AAL were listed in Supplementary Table S3.

