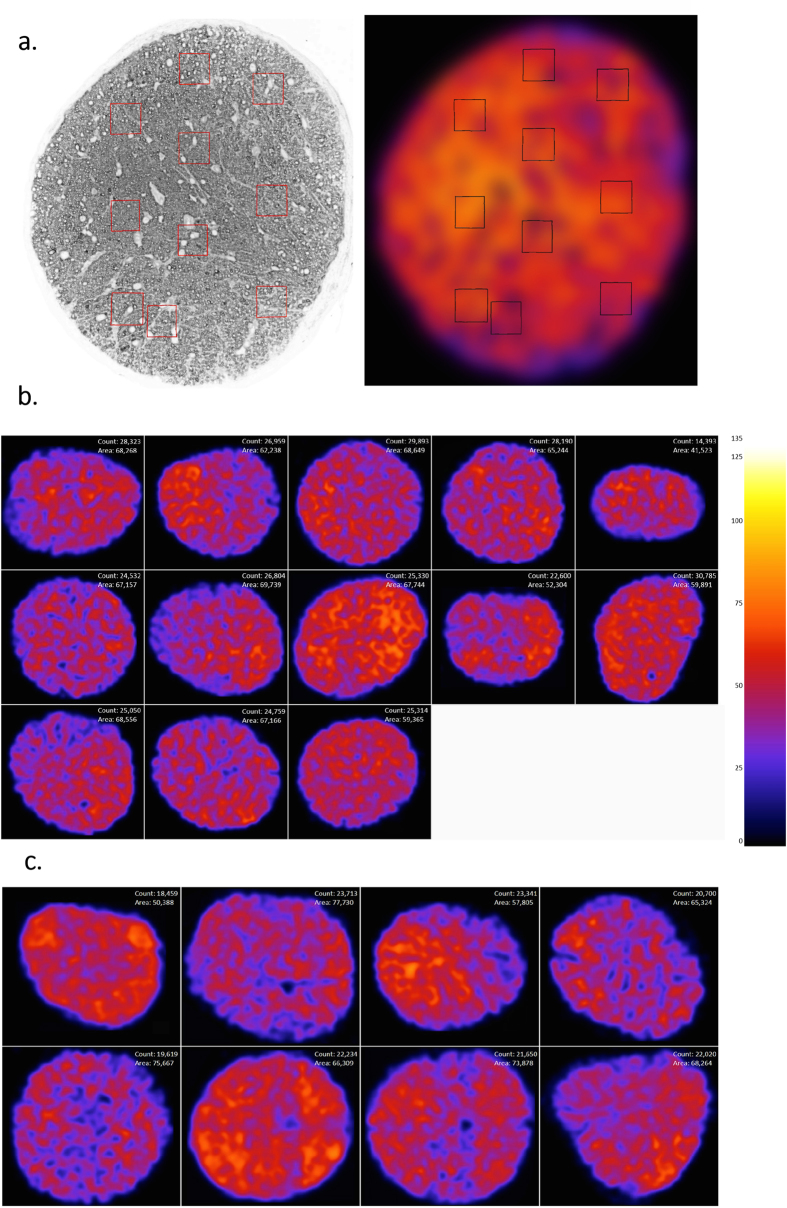
Figure 4. AxonJ axon density heat maps.
(a) AxonJ generated heat map of a whole optic nerve section showing the subimages that were sampled for manual counting by human experts indicated by boxes. (b) Density heat map for strain matched wt mice (image set C0), (c) density heat map for nee mice (image set C1), demonstrating the regional variation in density as well as optic nerve cross-sectional area. The heat map shows denser areas of axons as hotter, while colder regions represent less dense regions of axons. Whole-nerve axon count and optic nerve area (μm2) are provided for each cross section. Scale bar (axons/100 μm2).

