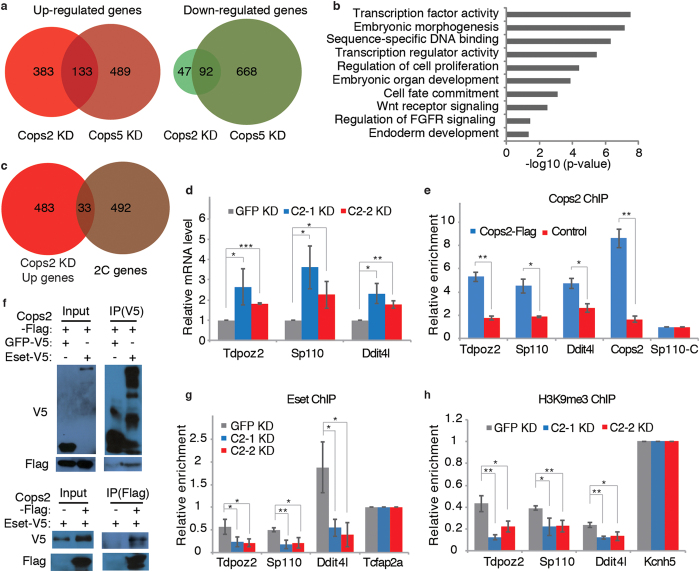
Figure 4. Cops2 acts as a transcriptional corepressor in ESCs.
(a) Venn diagrams of differentially expressed genes in Cops2 and Cops5 KD ESCs, compared to control GFP KD ESCs. (b) Gene ontology analysis of Cops2 regulated genes. (c) Venn diagram shows the overlap between Cops2 repressed genes and 2C genes. p = 5.466e-5; Fisher’s exact test. (d) The expression of 2C genes, Tdpoz2, Sp110, and Ddit4l, was measured by quantitative RT-PCR in GFP and Cops2 KD ESCs. (e) ChIP assays were performed with ESCs expressing Flag-tagged Cops2 and control ESCs. Sp110-C is located at the 3′-end of the Sp110 gene, and served as a negative control region for Cops2 binding. (f) Co-IP experiments to detect the interaction between Cops2 and Eset. Cops2-Flag, together with GFP-V5 or Eset-V5, was overexpressed in HEK293T cells. IP experiments were carried out with Flag or V5 antibodies. (g,h) ChIP experiments to detect Eset binding (g) and H3K9me3 (h) enrichment at the Tdpoz2, Sp110, and Ddit4l loci. ChIP assays were performed with GFP and Cops2 KD ESCs. Tcfap2a and Kcnh5 are positive control regions for Eset binding and H3K9me3 enrichment, respectively. Data are shown as mean ± SD (n = 3).

