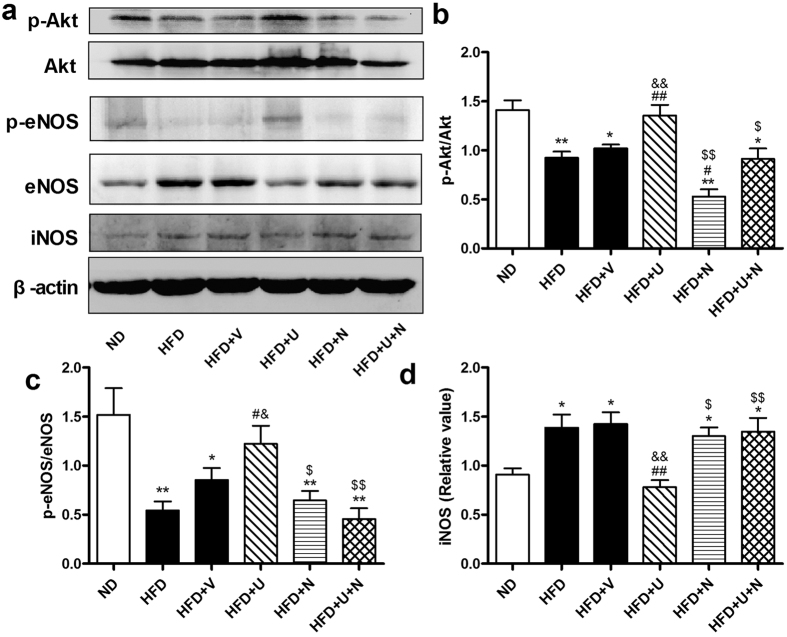
Figure 5. Effects of U50,488H on phosphorylation of Akt, eNOS and expression of iNOS in the absence and presence of nor-BNI in vivo.
(a) Representative blots of total and phosphorylated Akt, eNOS and iNOS in aorta tissue. (b) Statistical data obtained from quantitative densitometry of Akt blots. (c) Statistical data obtained from quantitative densitometry of eNOS blots. (d) Statistical data obtained from quantitative densitometry of iNOS blots. n = 10. Values are mean ± SEM. ND: normal diet group, HFD: high-fat diet group, HFD + V: high-fat diet + saline group, HFD + U: high-fat diet + U50,488H group, HFD + N: high-fat diet + nor-BNI group, HFD + U + N: high-fat diet + U50,488H + nor-BNI group. *P < 0.05, **P < 0.01 vs. ND, #P < 0.05, ##P < 0.01 vs. HFD, &P < 0.05, &&P < 0.01vs. HFD + V, $P < 0.05, $$P < 0.01 vs. HFD + U.

