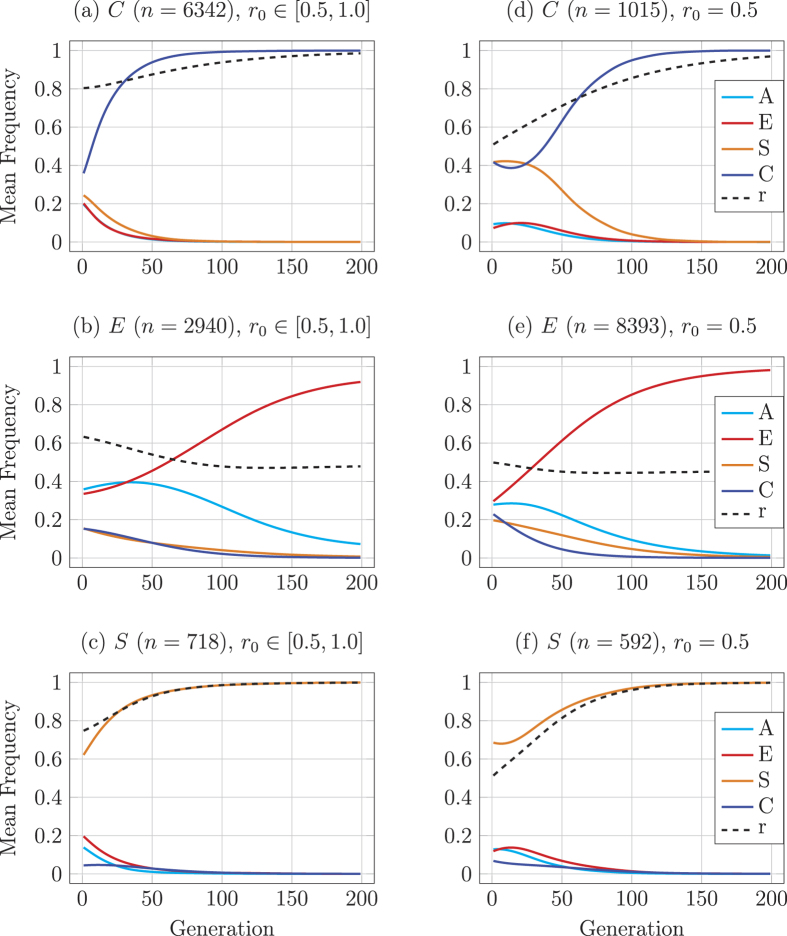
Figure 3. Mean evolutionary trajectories for the simulations of discerning recognition.
Runs that converge on the three dynamically stable equilibria C, E, or S are represented separately where n is the number of runs (out of 10000) that converge on each equilibrium and r0 is the initial value of recognition ability r. The left column (a–c) gives mean trajectories for simulation results when r0 is drawn from an uniform distribution over [0.5, 1.0]; the right column (d–f) gives results for r0 = 0.5. Simulations run with p = 0.4, for equal values for help conferred or harm inflicted (b = h = 1), equal costs to confer help or inflict harm (ch = cb = 0.2), with mutation (μ = 0.0001).

