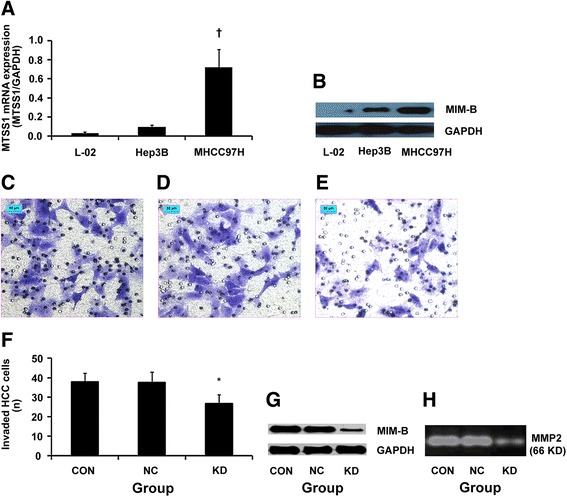
Fig. 3.

MTSS1/MIM-B expression in different cell lines. a, qRT-PCR analysis of MTSS1 mRNA expression; †P = 0.000, 0.001, respectively, when compared with cell lines of L02 and Hep3B. b, western blot analysis of MIM-B protein level; the bars indicate the means ± s.d. Stable lentiviral transfection of MHCC97H cells with siRNA targeting MTSS1, ×200, bar, 50 μm. Invasion assay analysis shown that the number of transfected HCC cells (original magnification, × 200) after treatment with MTSS1 siRNA lentivirus (e) was lower than that of controls (c, d), bar, 50 μm. f, the difference in invasiveness, *P = 0.000, when compared with controls. The assays were conducted in triplicate. The bars indicate the means ± s.d. g, western blot analysis demonstrated that MIM-B was down-regulated by siRNA. h, results of gelatin zymography assay shown that MMP2 activity was inhibited (0.6-fold) by siRNA, P = 0.000, compared with controls
