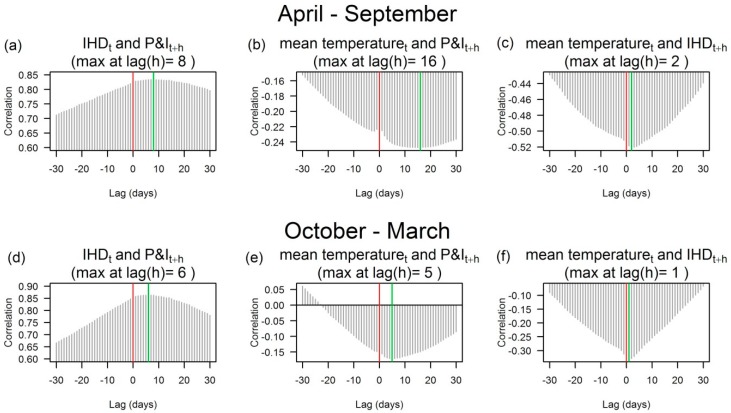
Figure 4.
Cross-correlations of daily P&I and IHD deaths and daily temperatures among the population aged 65 or older in Japan, 1973–2009. Cross-correlations identify the lags (h) of one variable () relative to the other (). The red vertical line at lag 0 is for the same day (t). The green vertical line highlights the lag h with the largest cross-correlation. The correlograms show the cross-correlations of (a) IHD and P&I deaths; (b) mean temperature and P&I deaths; (c) mean temperature and IHD deaths in a warm season (April to September); (d) P&I deaths; (e) mean temperature and P&I deaths; and (f) mean temperature and IHD deaths in a cold season (October to March).

