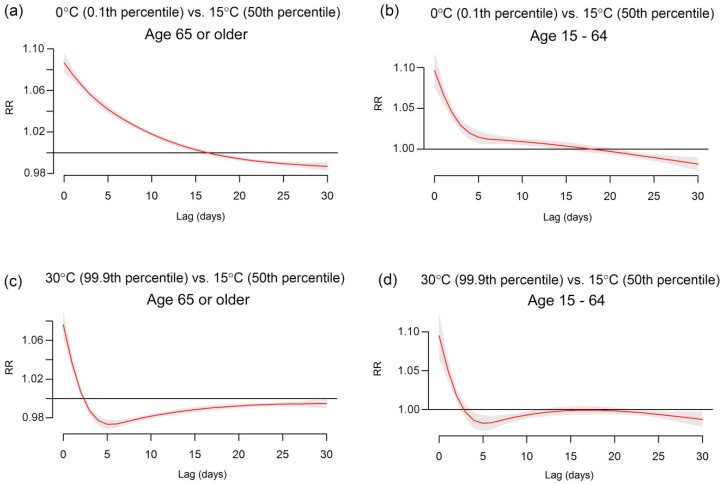
Figure 5.
The estimated delayed effects of extreme temperatures on IHD deaths for population aged 65 years or older and age of 15–64 in Japan, 1973–2012. The red lines show the mean association and the grey areas are 95% confidence intervals. The plots show the cold effects on (a) aged 65 years or older; (b) age of 15–64; and the heat effects on (c) aged 65 years or older; (d) age of 15–64.

