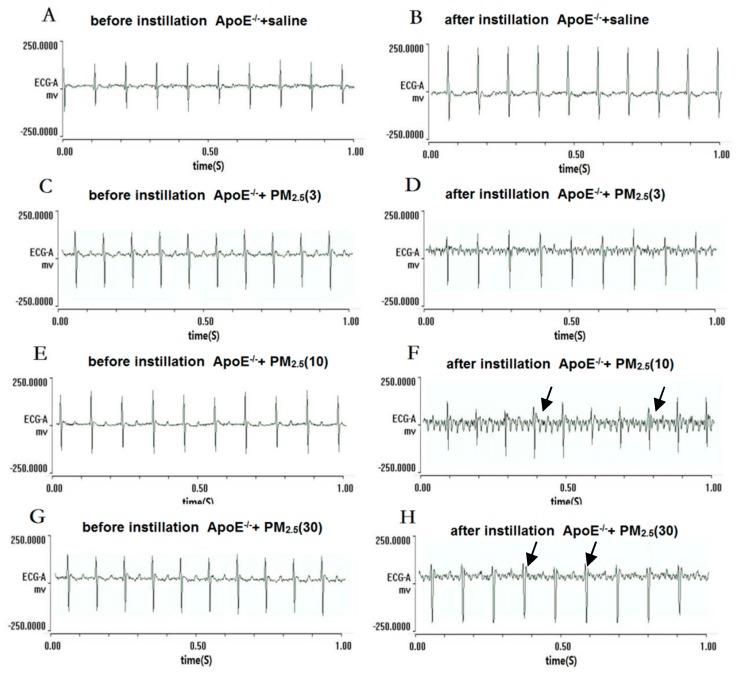
Figure 2.
Electrocardiogram (ECG) types before instillation and after instillation in ApoE−/− mice. (A,C,E,G) represent the ECG in the mice before PM2.5 treatment; (B,D,F,H) represent the ECG in the mice after PM2.5 treatment, the doses were 0, 3, 10, and 30 mg/kg b.w., respectively; (F) black arrows represent left bundle-branch block; and (H) black arrows represent right bundle-branch block (RBBB).

