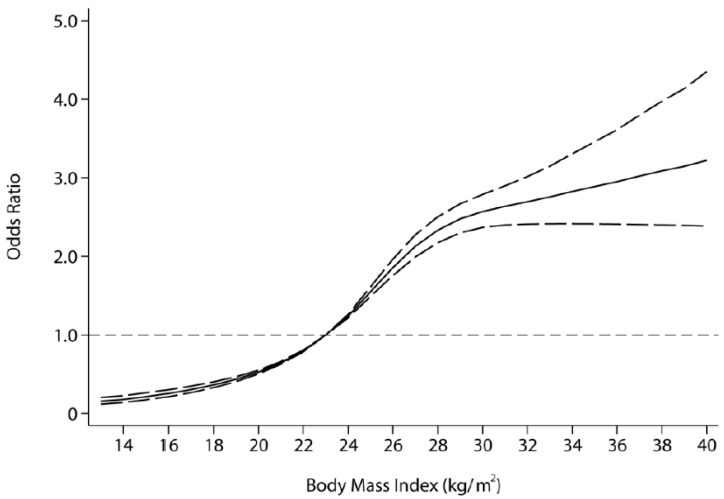
Figure 1.
The dose-response relationship of BMI and hyperlipidemia based on the restricted cubic spline model (BMI was coded using an RCS function with four knots located at the 17.71 kg/m2, 22.50 kg/m2, 26.83 kg/m2 and 31.52 kg/m2, which respectively correspond to four sections of the median BMI. Lines with long dashes represent the pointwise 95% confidence intervals, comparing for solid lines representing the fitted nonlinear trend).

