
Fig. 3.
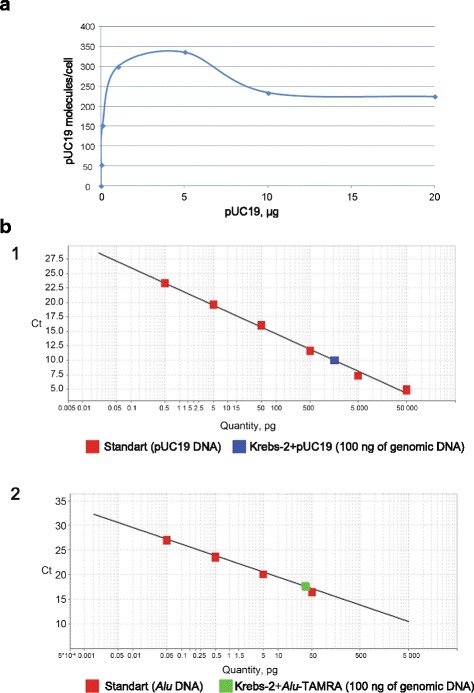
Copy number analysis of eDNA internalized by Krebs-2 cells. a saturation of Krebs-2 cells with increasing amounts of pUC19 DNA in the incubation medium. b qPCR quantification of pUC19 (1) and Alu DNA (2) present in Krebs-2 cells after co-incubation with eDNA. Linear calibration plot was constructed using StepOne v2.3 software; each datapoint was run in triplicate