Fig. 4.

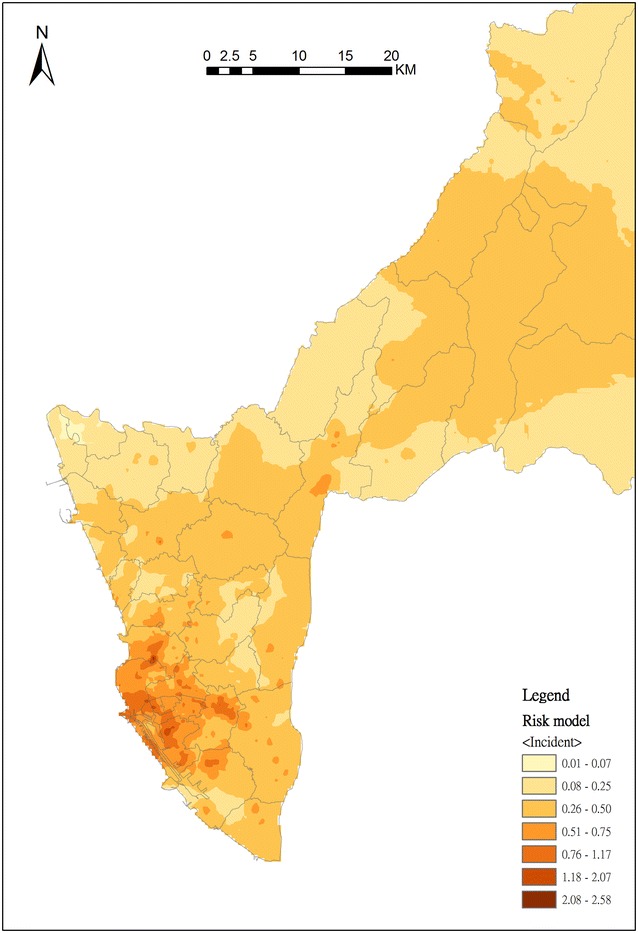
Geographical distribution of risk adjusted by spatial risk factors including the proportion of 65-and-older population, population density, and the percentages of housing, transformation and public categories in BSA

Geographical distribution of risk adjusted by spatial risk factors including the proportion of 65-and-older population, population density, and the percentages of housing, transformation and public categories in BSA