
Fig. 5.
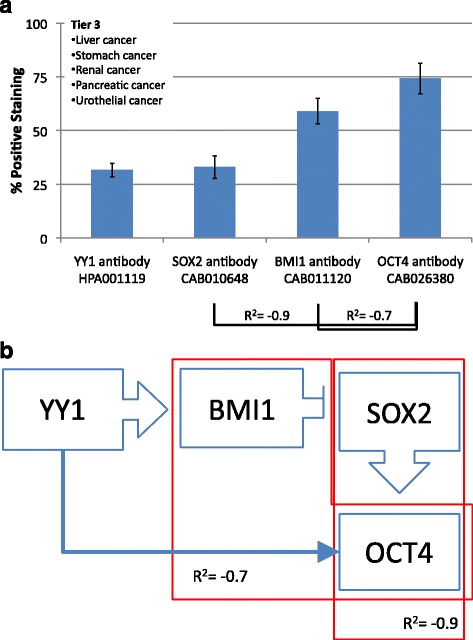
a Frequency of Protein expression. Antibody staining for liver, stomach, renal, pancreatic and urothelial cancers (Tier 3). There are significant negative correlations between SOX2 and OCT4 (R2 = −0.9) as well as between BMI1 and OCT4 (R2 = −0.7). b Hypothetical functional dynamic of CSC-related transcription factors. Correlations of the frequency of protein expression in a segregated malignancies tier