
Fig. 3.
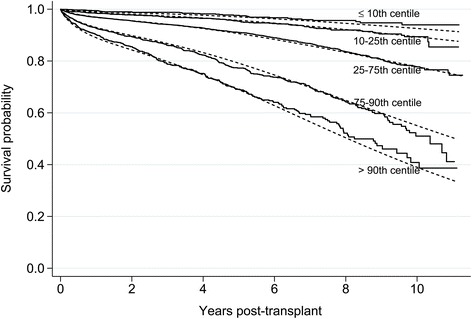
Comparison of Kaplan-Meier curves based on observed data (solid lines) and predicted mean survival curves based on final flexible parametric model (dotted lines) by prognostic group
Official websites use .gov
A
.gov website belongs to an official
government organization in the United States.
Secure .gov websites use HTTPS
A lock (
) or https:// means you've safely
connected to the .gov website. Share sensitive
information only on official, secure websites.
Comparison of Kaplan-Meier curves based on observed data (solid lines) and predicted mean survival curves based on final flexible parametric model (dotted lines) by prognostic group