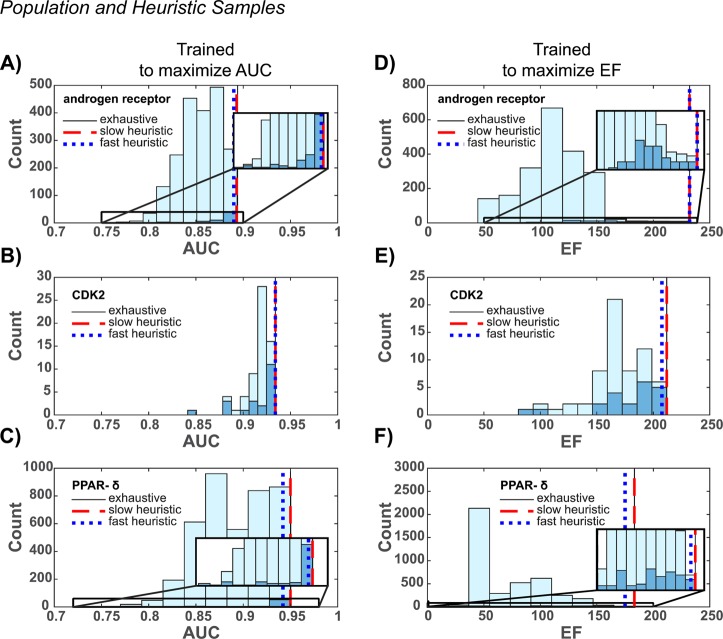
Figure 1.
AUC and EF histograms. The exhaustive method was used to enumerate all possible ensembles, and the AUC and EF values of the corresponding population were sorted into 10 bins and plotted in light blue. The slow heuristic method was used to sample a subset of the ensemble population, and the AUC and EF values were sorted into 10 bins and plotted in dark blue. Insets provide expanded views for the androgen receptor and PPAR-δ. AUC values for ensembles trained to maximize the AUC are reported as vertical lines in (A)–(C), and EF values for ensembles trained to maximize the EF are reported as vertical lines in (D)–(F).

