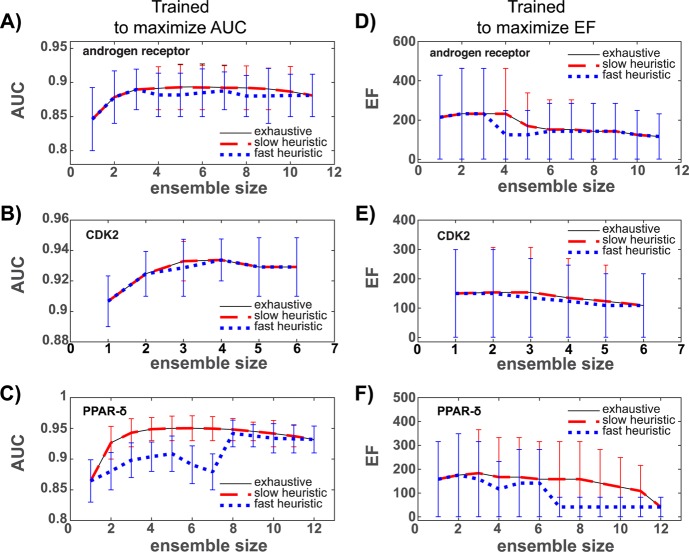
Figure 2.
Training set performance as a function of ensemble size for three proteins using DUD-E. AUC is the area under the ROC curve. EF is the ROC enrichment factor at a false positive fraction of 0.001. AUC values for ensembles trained to maximize the AUC are shown in (A)–(C), and EF values for ensembles trained to maximize the EF are reported in (D)–(F). Shown are 95% confidence intervals.

