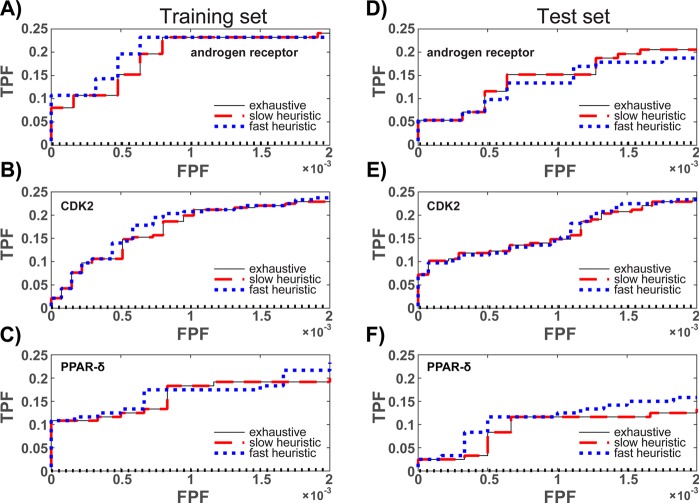
Figure 4.
Receiver operating characteristic (ROC) curves for ensembles trained to maximize the EF at a FPF of 0.001. Dotted black lines illustrate random classification. Training set values are shown in (A)–(C). Test set values are shown in (D)–(F). To be consistent with the training condition, the early portion of the ROC curve, with FPF values between 0 and 0.002, is shown.

