Fig. 7.
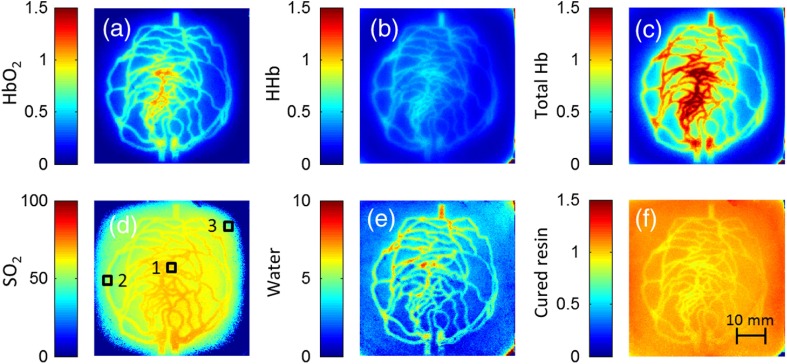
One-layer phantom chromophore concentrations and saturation maps 75 min after adding the solution: (a) , (b) deoxyhemoglobin (HHb), (c) total Hb, (e) water, and (f) cured resin. The hemoglobin saturation levels () map (d) is marked with three regions of interest (ROIs) used to generate results in Fig. 8.

