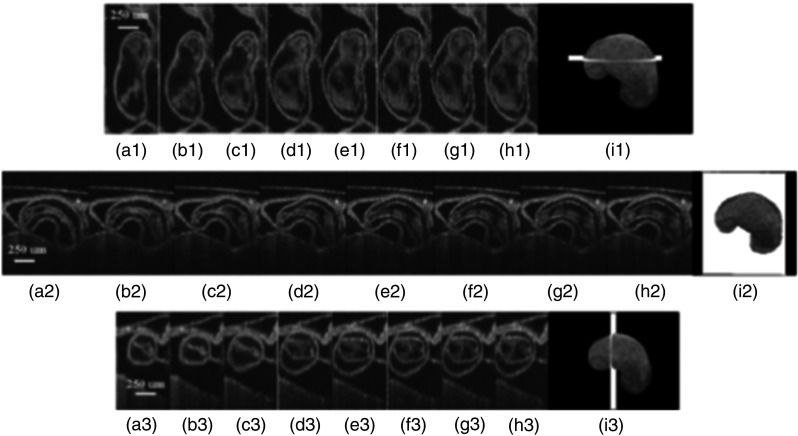
Fig. 5.
Eight phases of the beating embryonic quail heart from three different orientations acquired in vivo using gated OCT. Each time series progresses from systole to diastole and each slice is separated by 95 ms. (a) En face 2-D OCT images (sagittal to the body). (b) Eight phases from the normal OCT view (coronal to the body). (c) Transverse view of the heart. Images on the far right of each row show a 3-D surface reconstruction of the heart in phase 8 (diastole). The white plane indicates the position of the corresponding 2-D OCT images in that row. Adapted from Ref. 90.

