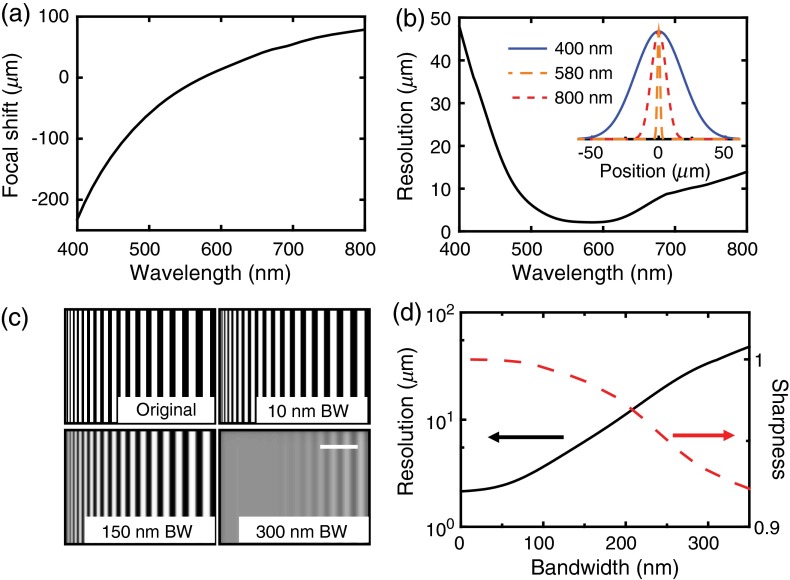
Fig. 2.
Simulation results: (a) focal shift as a function of center wavelength; (b) resolution variation as a function of center wavelength, inset is the corresponding point spread function under three color-coded wavelengths (400, 580, and 800 nm); (c) computer generated grating pattern images under different illumination bandwidths. BW, bandwidth; scale bar: . (d) Resolution (black solid line) and sharpness (red dashed line) as functions of illumination bandwidth.

