. 2015 Oct 28;20(10):106011. doi: 10.1117/1.JBO.20.10.106011

Fig. 3.

Fig. 3

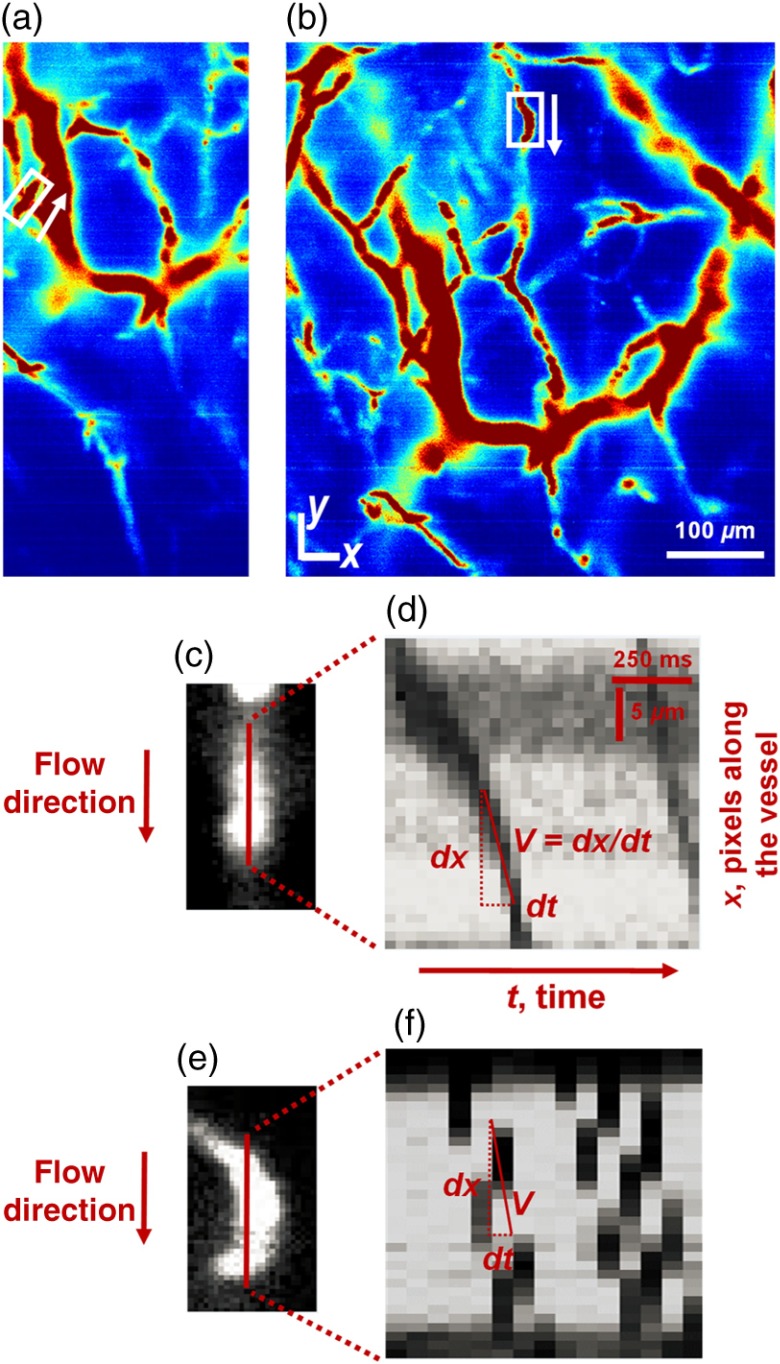
A maximum-intensity projection (in the axial or z-direction) of a stack of images collected at depths ranging from z=125 to 200  μm from the surface of a mouse ear at a frame rate of (a) 30 fps over a field of view (FOV) of 250×500  μm (Video 1) and (b) at 15 fps over a FOV of 500×500  μm (Video 2). (Video 1, MPEG, 389 KB [URL: http://dx.doi.org/10.1117/1.JBO.20.10.106011.1]; Video 2, MPEG, 2.3 MB [URL: http://dx.doi.org/10.1117/1.JBO.20.10.106011.2]). (c) and (e) Single-vessel images cropped from regions indicated in (a) and (b). The red lines indicate the locations where line-profile data are analyzed in panels (d) and (f) to quantify the velocity of the erythrocytes. The arrows indicate the direction of flow. The line profiles are arranged in the order of increasing time to calculate the velocity of the blood cells (see text for details). (d) Thirty line profiles from serially acquired images (with a frame rate of 30 fps). (f) Fifteen line profiles from serially acquired images (with a frame rate of 15 fps).