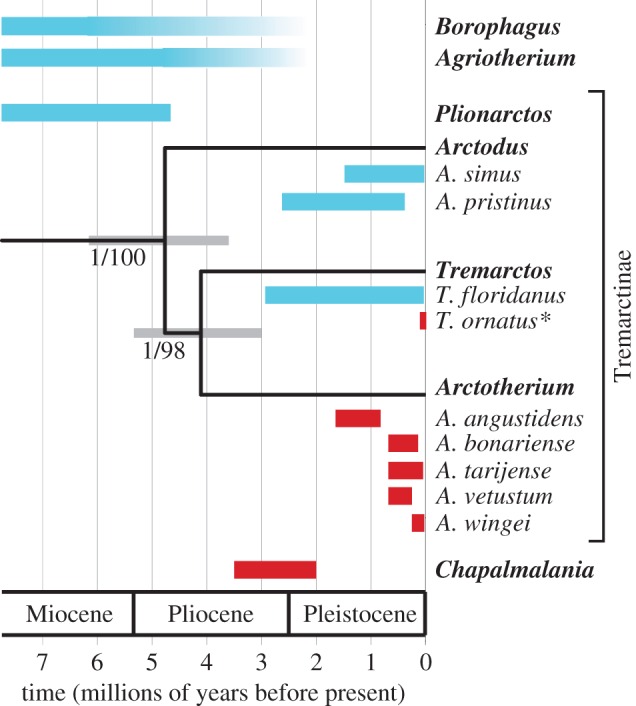
Figure 1.

Relationships among tremarctine genera resulting from phylogenetic analysis of our mitochondrial genome dataset. Nodes reflect mean age estimates, whereas grey bars reflect 95% highest posterior densities (HPDs). Branch support values (BEAST posterior probability/RAxML bootstrap %) are given for each clade. The approximate temporal range of taxa of interest (see main text) is plotted based on the fossil record, and coloured according to distribution (North America, blue; South America, red). The extant taxon is marked with an asterisk.
