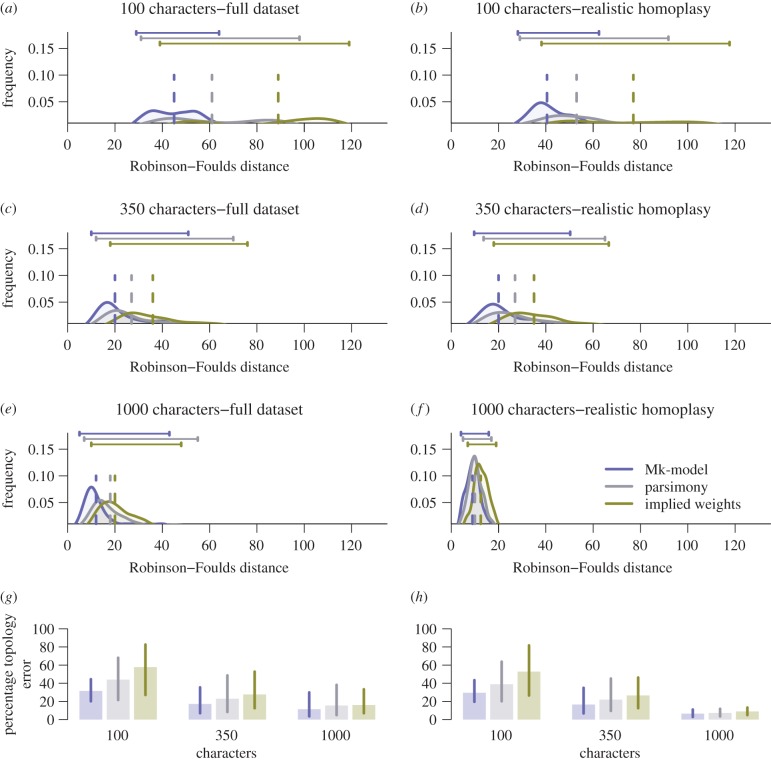
Figure 1.
Mk tree reconstructions (blue) outperform equal-weights parsimony (grey) and implied-weights parsimony (green) for 100, 350 and 1000 characters (a,c,e,g), and these differences remain in the subset of the simulated data matrices that exhibit realistic levels of homoplasy (b,d,f,h). Bars above the plots mark the 95th percentile range for each method, and dashed vertical lines show the median values. Percentage topology error (g,h) is the Robinson–Foulds value of the reconstructed tree compared with the worst possible value, as shown in [5].

