Figure 3.

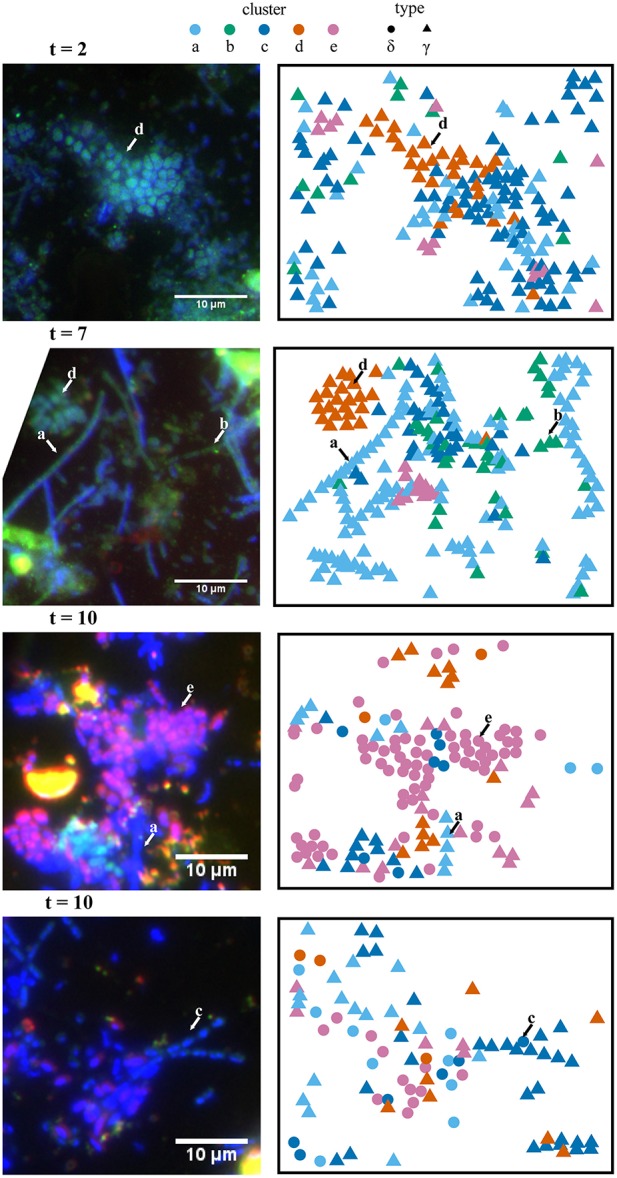
Spatial (x,y) projections of isotope phenotype clusters determined from NanoSIMS data and corresponding FISH images. Independent analysis of these two data sets showed consistent correspondence between the isotope phenotypes (clusters a–e) and the morphologies and phylogenetic affiliation of cells determined in the FISH experiments. For example, cluster “e” primarily corresponds with putative sulfate-reducing bacteria hybridized with a deltaproteobacterial probe (purple). FISH (left panels) was performed with probe Delta495a targeting Deltaproteobacteria (purple) and Gam42a targeting Gammaproteobacteria (green). Representative cells for isotope phenotype clusters a–e, determined from fuzzy c-means cluster analysis of NanoSIMS data, are indicated with arrows in the FISH images. Clusters “a,” “b,” and “c” are primarily affiliated with filamentous Gammaproteobacteria. Cluster “d” is primarily affiliated with clusters of coccoidal Gammaproteobacteria, andcluster “e” is primarily affiliated with Deltaproteobacteria. FISH images were rotated to match the NanoSIMS image orientation, which resulted in the cropping of some images.
