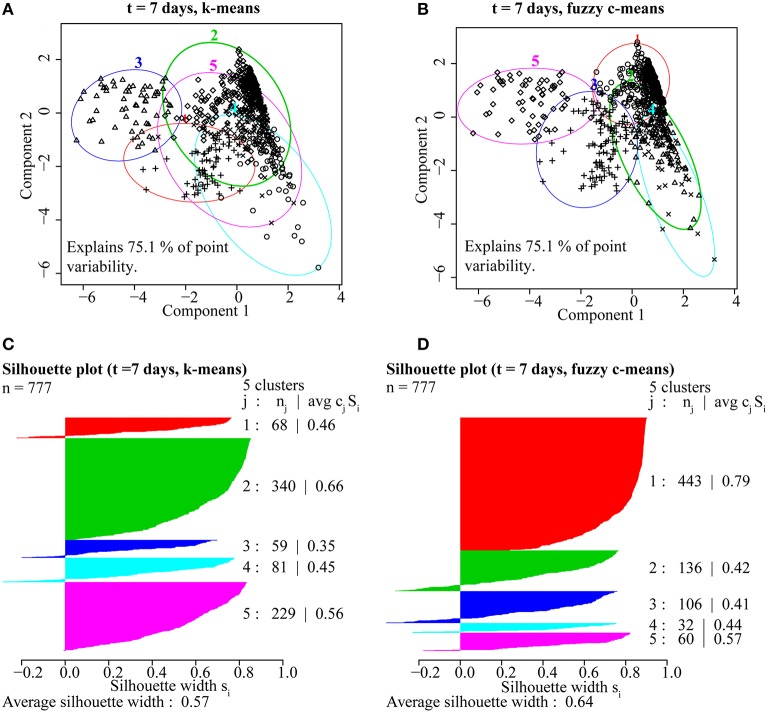
Figure 5.
A comparison of partitioning by (A) k-means and (B) fuzzy c-means for ROIs from the t = 7 day NanoSIMS isotope and elemental ratio data showed that fuzzy c-means resulted in better cluster resolution. The fuzzy c-means clustering solution minimized overlap (A,B) and resulted in higher average silhouette width (avg cjSj), a measure of intra-cluster cohesion and inter-cluster separation, for ROIs (nj) distributed into the five clusters (j; C,D).

