Figure 7.
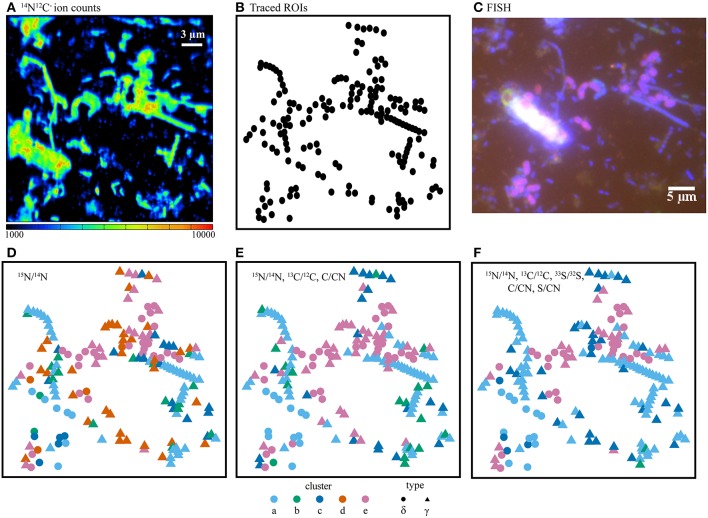
(A) NanoSIMS ion counts from 14N12C− as a proxy for biomass, (B) cell outlines (ROIs), and (C) the corresponding FISH image. Comparison of isotope and elemental ratio data resulting from SIP experiments using 15 + 13C-acetate + 33 where fuzzy c-means cluster determination was based on (D) one ratio, (E) three ratios, or (F) five ratios. Here, the use of five ratios provided the best differentiation of cell types as compared with the independent FISH data. In panels D–F, ROI colors were determined by cluster assignment (a–e). Phylogenetic assignments to “δ” (Deltaproteobacteria) or “γ” (Gammaproteobacteria) were determined by overlaying ROI positions in the NanoSIMS and FISH images prior to cluster analysis. FISH experiments (C) were performed with probes for Deltaproteobacteria (purple), Gammaproteobacteria (blue-green), and counter-stained with DAPI (blue).

