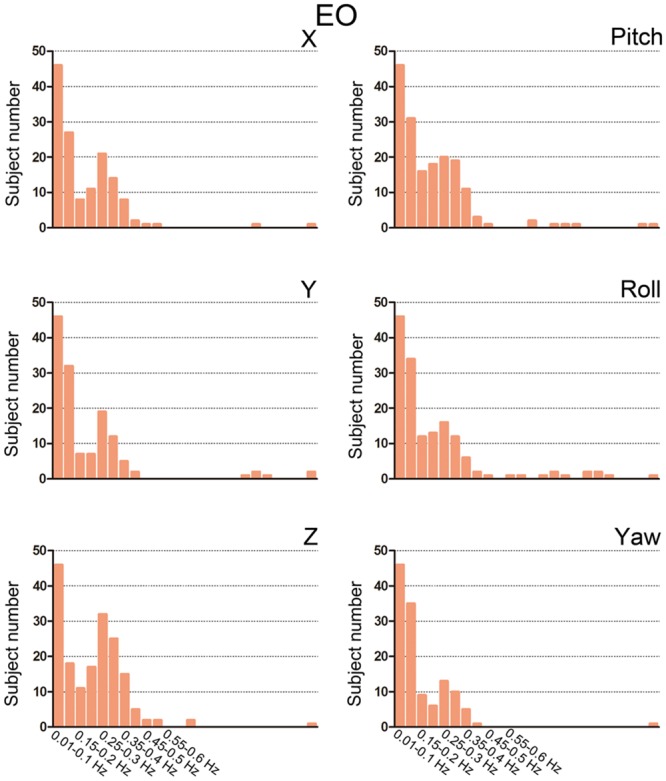
FIGURE 4.

Bar graphs showing the number of subjects with prominent high-frequency HM. For each sub-band, we counted the number of subjects whose power fraction was larger than 1/24 total power for the EO state. We used the threshold 1/24 because there are 23 high-frequency sub-bands between 0.1 and 1.25 Hz when the step is 0.05 Hz. If the high-frequency HM was not large enough, then the power should be equally distributed between 0.1 and 1.25 Hz.
