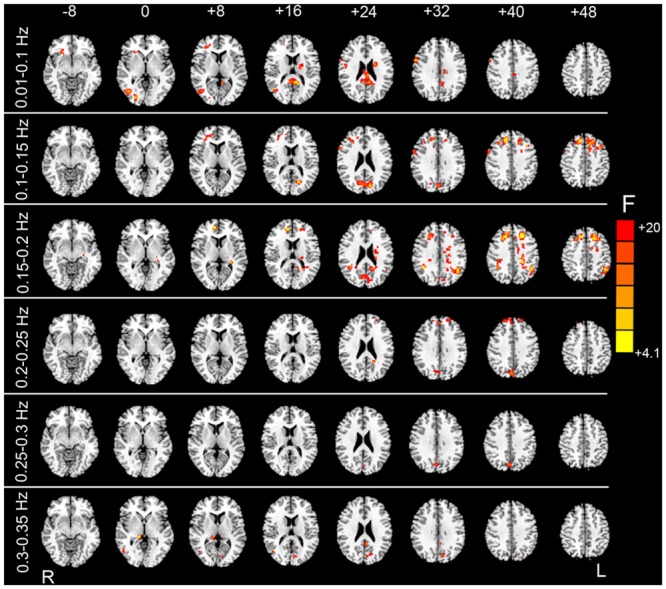
FIGURE 6.

F test results showing the HM-related effects. By taking the mean FD as a covariate in the paired t-test GLM, we examined whether mean FD could account for some inter-subject variance. After individual-level HMR, motion-related variance was still significant in the prefrontal cortex, visual cortex, and white matter (WM) (p < 0.05, corrected).
