
Figure 5. Components Detected in a Whole Zebrafish Brain.
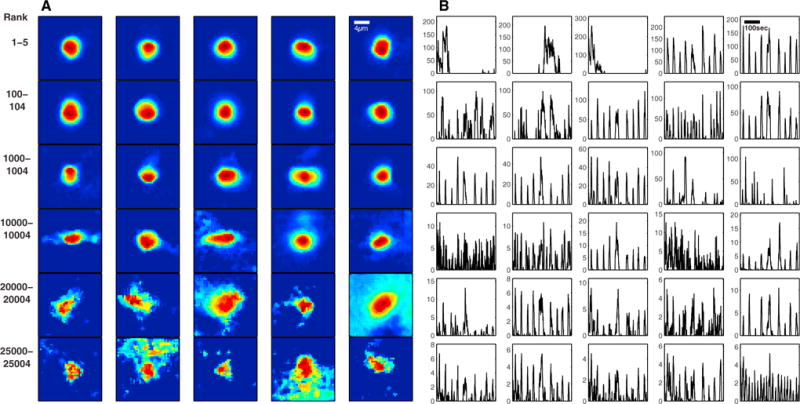
A sample of detected components (A, inferred neuronal shapes; B, inferred DF/F activity traces), ordered according to their rank. High-ranking components match expected nuclear-localized neuronal shapes and activity visible in the raw video data; low-ranking components tend to be more “noisy” in both shapes and activity. In all, the first 26,000 components largely correspond to reasonable neuronal signals (as determined by visual inspection of the video data; Movies S2, S3, and S4).