
Figure 7. Application to In Vivo Dendritic Imaging Data from Rodent Barrel Cortex.
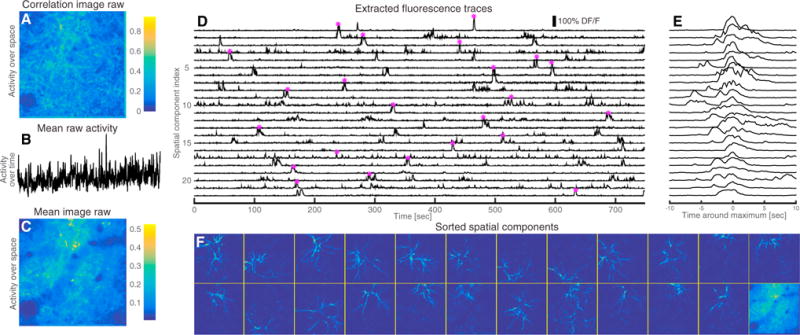
(A) Correlation image of the raw data. Due to the high degree of overlap, the correlation image cannot be used to segment the video.
(B) Spatially averaged activity over time of the raw data.
(C) Mean activity over time.
(D) DF/F temporal traces of the top 23 components extracted from our algorithm.
(E) Close up and centering around the point of maximum activation for each trace (indicated by the star marker in D).
(F) Sorted spatial footprints and background (lower right corner). The proposed method can segment the dense dendritic imaging data and reveal a rich underlying sparse structure (see also Movie S9).