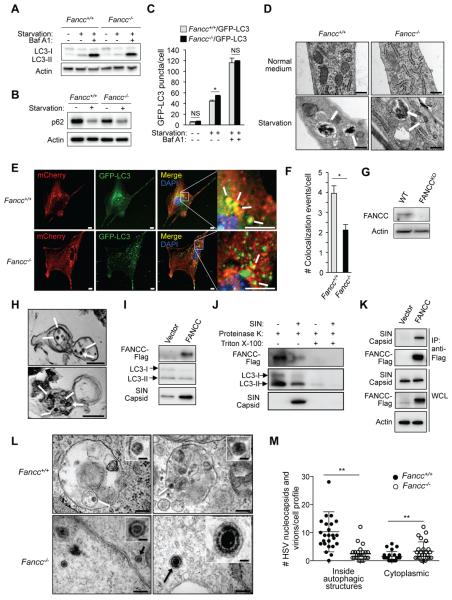
Figure 1. Fancc is Required for Autophagic Targeting of Genetically Distinct Viruses, but Not for Starvation-Induced Autophagy.
(A) Western blot of LC3-I/LC3-II in primary murine embryonic fibroblasts (MEFs) during growth in normal (starvation −) or EBSS (starvation +) medium for 4 hr +/− 100 nM bafilomycin A1 (Baf A1).
(B) Western blot of p62 in MEFs in culture conditions as in (A).
(C) Quantification of GFP-LC3 puncta (autophagosomes) in Fancc+/+/GFP-LC3 and Fancc−/−/GFP-LC3 MEFs during growth in normal or starvation medium for 4 hr +/− 100 nM Baf A1. Bars are mean ± SEM for triplicate samples (>100 cells analyzed per sample by an observer blinded to experimental condition). NS, not significant; *, P<0.05; t-test.
(D) EM of autophagic structures in MEFs during growth in normal or starvation medium (EBSS, 4 hr). White arrows indicate autolysosomes. Scale bars, 1 μm.
(E and F) Representative light micrographs of images (E) used for quantification (F) of colocalization of SIN/mCherry.capsid and GFP-LC3 in MEFs infected with SIN mCherry.capsid/GFP-LC3 (multiplicity of infection [MOI] = 2.5 plaque-forming units [PFUs], 18 hr). In (E), white arrows denote representative colocalized mCherry.capsid and GFP-LC3 signal. Scale bars, 10 μm. In (F), bars are mean ± SEM for triplicate samples (> 50 cells analyzed per sample by an observer blinded to experimental condition). *, P<0.05; t-test.
(G) Western blot of FANCC in HeLa WT and HeLa FANCCKO cells.
(H) EM of immunoprecipitated autophagic structures using an anti-LC3 antibody from HeLa FANCCKO cells transduced with a lentivirus expressing FANCC-Flag and infected with SIN strain SVIA (MOI = 5, 6 hr). White arrows indicate SIN nucleocapsids inside autolysosomes. Asterisks indicate dynabeads used for IP. Scale bars, 200 nm.
(I) Western blot of indicated proteins in anti-LC3 immunoprecipitates (representative electron microscopes shown in (H)) from HeLa FANCCKO cells transduced with lentivirus vector (HeLa FANCCKO/vector) or lentivirus expressing FANCC-Flag (HeLa FANCCKO/FANCC) and infected with SIN strain SVIA (MOI = 5, 6 hr).
(J) Western blot of indicated proteins in control and SIN-infected HeLa FANCCKO/FANCC cells subjected to anti-LC3 IP as in (H-I) and then 30 min digestion on ice with 2.5 ng/ml proteinase K +/− 0.5% triton X-100.
(K) Co-IP of SIN capsid protein with FANCC-Flag in HeLa FANCCKO/vector (Vector) or HeLa FANCCKO/FANCC (FANCC) cells infected with SIN strain dsTE12Q (MOI = 5, 6 hr).
(L) Representative EMs of MEFs infected with HSV-1 ICP34.5Δ68-87 (MOI = 5, 6 hr). White arrows denote representative HSV-1 nucleocapsids being degraded inside autolysosomes. Black arrows denote representative HSV-1 nucleocapsid (bottom left) or assembled HSV-1 virion (bottom right) inside the cytoplasm. Scale bars, 200 nm for large panels; 50 nm for insets.
(M) Quantification of HSV-1 nucleocapsids and virions within autophagosomes or autolysosomes (inside autophagic structures) or free within the cytoplasm (cytoplasmic) in experiment shown in (L). Twenty-five HSV-1-infected cell profiles were counted per genotype by an observer blinded to experimental conditions. **, P<0.01; Mann-Whitney U test.
In A-C, E and F, and I-K, similar results were observed in three independent experiments.
See also Figure S1.

