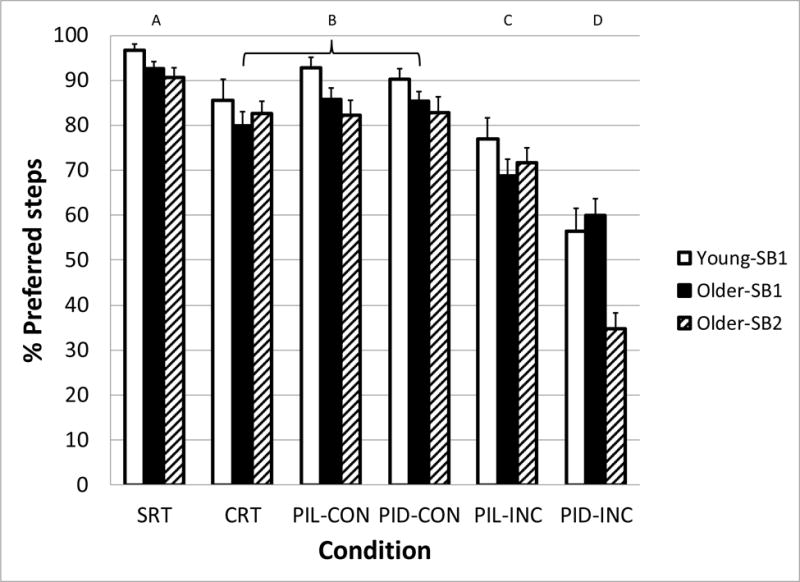
Figure 2.

Percentage of step trials in which subject groups (Young-SB1, Older-SB1, and Older-SB2) displayed their preferred step behavior as a function of the task condition. Preferred step behavior was determined from the Simple Reaction Time task condition. Letters above graph indicate task conditions that are statistically different from the others. SRT: Simple Reaction Time, CRT: Choice Reaction Time, PIL: Perceptual Inhibition-Location, PID: Perceptual Inhibition-Direction, CON: Congruous trials, INC: Incongruous trials. Error bars represent standard error of the mean.
