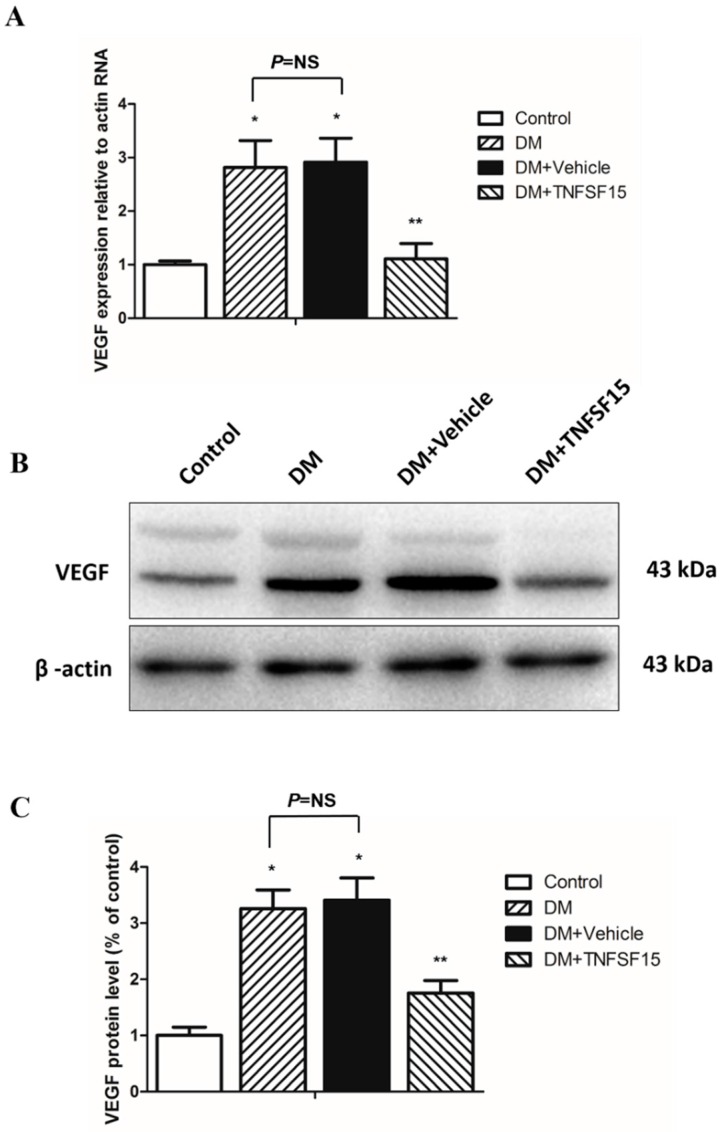
Figure 6.
VEGF expression decreased in the retina of diabetic rats treated with TNFSF15. (A) RT-PCR analysis for VEGF mRNA in retinal tissue. Data are shown as the mean ± SD. ANOVA (one-way) followed by the LSD test. * p < 0.001, significantly different from the control group; ** p < 0.001, significantly different from the DM group; NS = nonsignificance; (B) A representative Western blot image is shown; (C) Image of a Western blot analysis is shown: the data are shown as a percentage of the control and are presented as the mean ± SD of eight eyes. ANOVA (one-way) followed by the LSD test. * p < 0.001, significantly different from the control group; ** p < 0.001, significantly different from the DM group; NS = nonsignificance.

