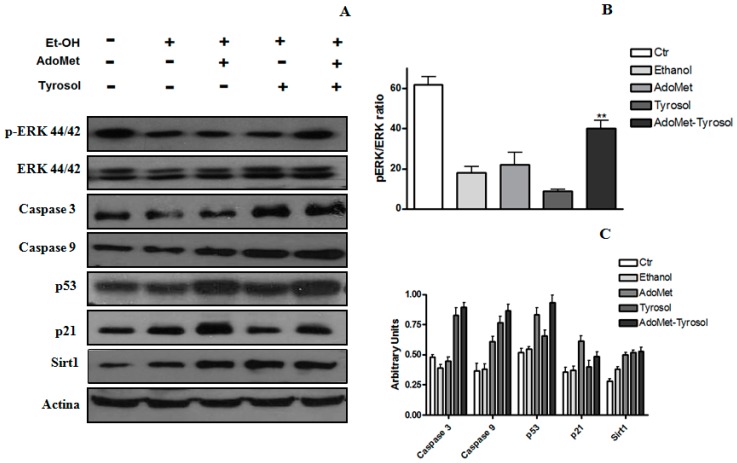
Figure 3.
Effect of AdoMet, Tyr, and their combination on protein expression in HepG2 cells after acute ethanol treatment. The expression in cell lysates of SIRT1, Erk, p-Erk, caspase 3, caspase 9, p53, p21, and SIRT1 was assessed by Western-blot analysis using β-actin as an internal control (A); Densitometric quantitation of pERK/ERK ratio in different conditions (B); Densitometric quantification of SIRT1, caspase 3, caspase 9, p53, and p21 (C). Values represent the mean ± SD of three experiments. ** p < 0.01 was considered significant for ethanol alone.

