Figure 6.
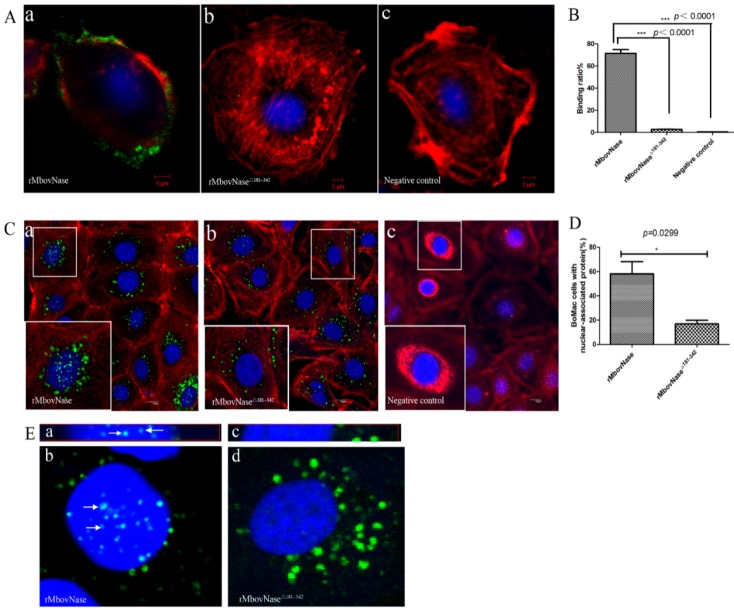
Assay of rMbovNase adhesion and invasion to BoMac cells. (A) Binding of rMbovNase and its variant to BoMac cells observed by confocal laser microscopy. BoMac cells were incubated with 10 μg·mL−1 rMbovNase (a) or rMbovNaseΔ181–342 (b) for 30 min at 4 °C. The attached protein was probed with mouse antiserum against rMbovNase (1:500) and then with goat anti-mouse IgG conjugated with FITC (green) Cellular actin filaments and nuclei were stained with rhodamine phalloidin (red) and DAPI (blue) respectively; magnifications: ×1000; (B) Binding assayed by flow cytometry. Standard deviations from the individual measurements are indicated as bars. *** p < 0.01; (C) Effect of TNASE_3 domain on invasion of rMbovNase (a) and rMbovNaseΔ181–342 (b). The method was the same as in the binding assay but incubated for 24 h at 37 °C. Laser confocal microscopy shows the deletion of TNASE_3 region in rMbovNase impaired its nuclear translocation but did not effect its internalization to cytoplasm. PBS treatment was negative control (c); magnifications: ×400; the zoomed images in the lower left boxes are ×3 magnifications of the images in middle small boxes; (D) Percentage of BoMac cells with nuclear-associated rMbovNase and rMbovNaseΔ181–342 immunofluorescence 24 h post-infection. Values are the means of 10 random microscopic fields and are representative of two independent experiments. Results were expressed as mean percentages ± SEM and were analyzed with the unpaired t-test. The difference between rMbovNase and its variant was statistically significant (*p = 0.029); (E) Localization of rMbovNase (a,b) in nuclei of BoMac cells shown by Z-series scanning. White arrows indicate the localization of rMbovNase within nuclear regions based on serially produced sections, while rMbovNaseΔ181–342 (c,d) only appeared in cytoplasm; magnifications: ×1000.

